How to Create Matplotlib Contour Plots from Points: A Comprehensive Guide
Matplotlib contour from points is a powerful technique for visualizing 3D data in a 2D format. This article will explore the various aspects of creating contour plots using Matplotlib, focusing on generating these plots from scattered points. We’ll cover everything from basic concepts to advanced techniques, providing numerous examples along the way.
Preparing Data for Matplotlib Contour Plots
Before creating a contour plot from points, it’s crucial to prepare your data correctly. Matplotlib contour from points typically requires your data to be in a grid format. If you have scattered points, you’ll need to interpolate them onto a regular grid.
Here’s an example of how to prepare scattered data for a contour plot:
import numpy as np
import matplotlib.pyplot as plt
from scipy.interpolate import griddata

# Generate scattered points
np.random.seed(42)
x = np.random.rand(100) * 10
y = np.random.rand(100) * 10
z = np.sin(x) * np.cos(y)

# Create a regular grid
xi = np.linspace(x.min(), x.max(), 100)
yi = np.linspace(y.min(), y.max(), 100)
xi, yi = np.meshgrid(xi, yi)

# Interpolate scattered data to regular grid
zi = griddata((x, y), z, (xi, yi), method='cubic')

# Create contour plot
plt.figure(figsize=(10, 8))
plt.contourf(xi, yi, zi, levels=15, cmap='viridis')
plt.colorbar(label='z values')
plt.title('Matplotlib Contour from Interpolated Points - how2matplotlib.com')
plt.xlabel('X-axis')
plt.ylabel('Y-axis')
plt.show()
Output:
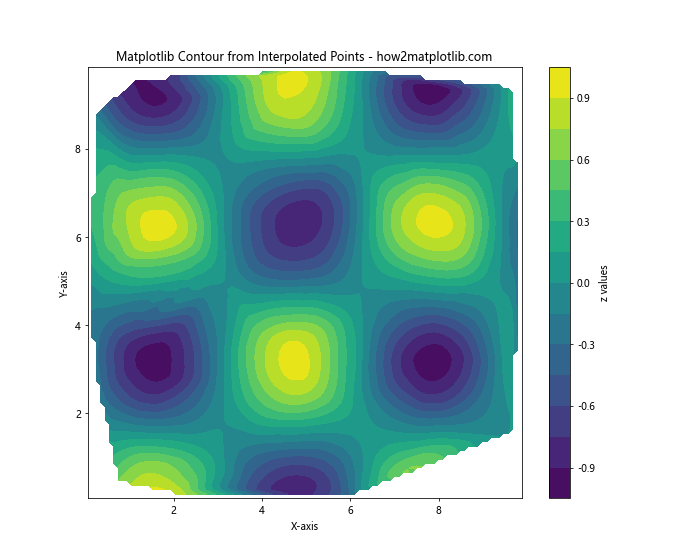
In this example, we use SciPy’s griddata function to interpolate our scattered points onto a regular grid. This step is crucial for creating smooth contour plots from irregularly spaced data points.
Basic Matplotlib Contour Plot Customization
Matplotlib contour from points offers various customization options to enhance the visual appeal and readability of your plots. Let’s explore some basic customization techniques:
Adjusting Contour Levels
You can control the number and values of contour levels:
import numpy as np
import matplotlib.pyplot as plt

x = np.linspace(-3, 3, 100)
y = np.linspace(-3, 3, 100)
X, Y = np.meshgrid(x, y)
Z = np.sin(X) * np.cos(Y)

plt.figure(figsize=(12, 4))

plt.subplot(121)
plt.contour(X, Y, Z, levels=5)
plt.title('5 Contour Levels - how2matplotlib.com')

plt.subplot(122)
plt.contour(X, Y, Z, levels=[-0.5, 0, 0.5])
plt.title('Custom Contour Levels - how2matplotlib.com')

plt.tight_layout()
plt.show()
Output:
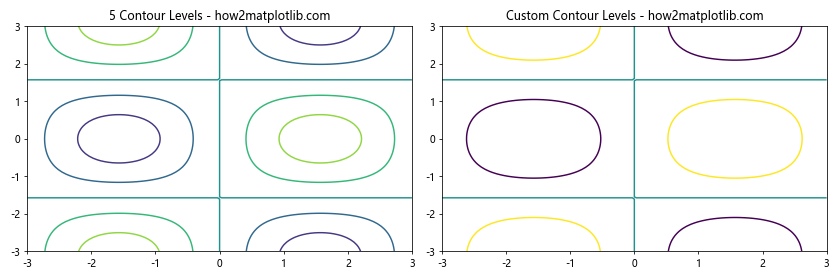
This example demonstrates how to set a specific number of contour levels and how to define custom level values.
Adding Color to Contour Plots
Color can greatly enhance the readability of your contour plots:
import numpy as np
import matplotlib.pyplot as plt

x = np.linspace(-3, 3, 100)
y = np.linspace(-3, 3, 100)
X, Y = np.meshgrid(x, y)
Z = np.sin(X) * np.cos(Y)

plt.figure(figsize=(12, 4))

plt.subplot(121)
plt.contourf(X, Y, Z, levels=20, cmap='viridis')
plt.colorbar(label='Z values')
plt.title('Filled Contour Plot - how2matplotlib.com')

plt.subplot(122)
cs = plt.contour(X, Y, Z, levels=20, cmap='coolwarm')
plt.clabel(cs, inline=1, fontsize=10)
plt.title('Labeled Contour Plot - how2matplotlib.com')

plt.tight_layout()
plt.show()
Output:
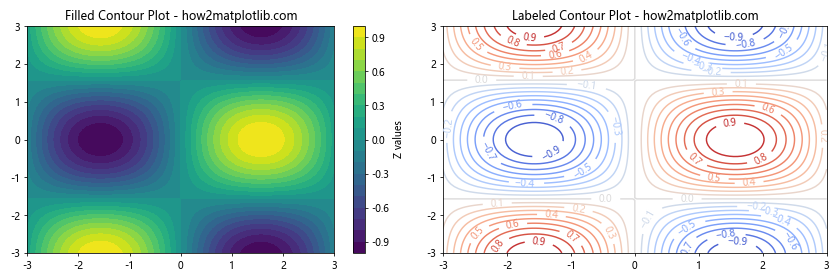
This example shows how to create filled contour plots with contourf() and how to add labels to contour lines using clabel().
Advanced Matplotlib Contour Plot Techniques
Now that we’ve covered the basics, let’s explore some advanced techniques for creating matplotlib contour from points.
Combining Contour Plots with Other Plot Types
You can overlay contour plots with other types of plots for more comprehensive data visualization:
import numpy as np
import matplotlib.pyplot as plt

x = np.linspace(-3, 3, 100)
y = np.linspace(-3, 3, 100)
X, Y = np.meshgrid(x, y)
Z = np.sin(X) * np.cos(Y)

plt.figure(figsize=(10, 8))

# Create filled contour plot
plt.contourf(X, Y, Z, levels=20, cmap='viridis', alpha=0.7)

# Overlay contour lines
cs = plt.contour(X, Y, Z, levels=10, colors='k', linewidths=0.5)
plt.clabel(cs, inline=1, fontsize=8)

# Add scatter plot
np.random.seed(42)
scatter_x = np.random.uniform(-3, 3, 50)
scatter_y = np.random.uniform(-3, 3, 50)
plt.scatter(scatter_x, scatter_y, c='red', s=20)

plt.colorbar(label='Z values')
plt.title('Combined Contour and Scatter Plot - how2matplotlib.com')
plt.xlabel('X-axis')
plt.ylabel('Y-axis')
plt.show()
Output:
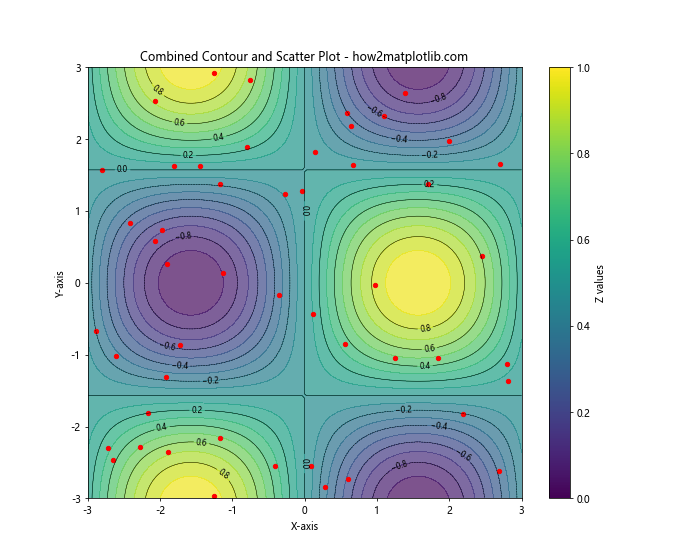
This example demonstrates how to combine a filled contour plot with contour lines and a scatter plot.
Creating 3D Contour Plots
While traditional contour plots are 2D, you can also create 3D contour plots using Matplotlib:
import numpy as np
import matplotlib.pyplot as plt
from mpl_toolkits.mplot3d import Axes3D

x = np.linspace(-3, 3, 50)
y = np.linspace(-3, 3, 50)
X, Y = np.meshgrid(x, y)
Z = np.sin(X) * np.cos(Y)

fig = plt.figure(figsize=(12, 6))

ax1 = fig.add_subplot(121, projection='3d')
ax1.contour3D(X, Y, Z, 50, cmap='viridis')
ax1.set_title('3D Contour Plot - how2matplotlib.com')

ax2 = fig.add_subplot(122, projection='3d')
ax2.plot_surface(X, Y, Z, cmap='viridis')
ax2.contour(X, Y, Z, zdir='z', offset=-2, cmap='coolwarm')
ax2.set_title('3D Surface with Contour - how2matplotlib.com')

plt.tight_layout()
plt.show()
Output:
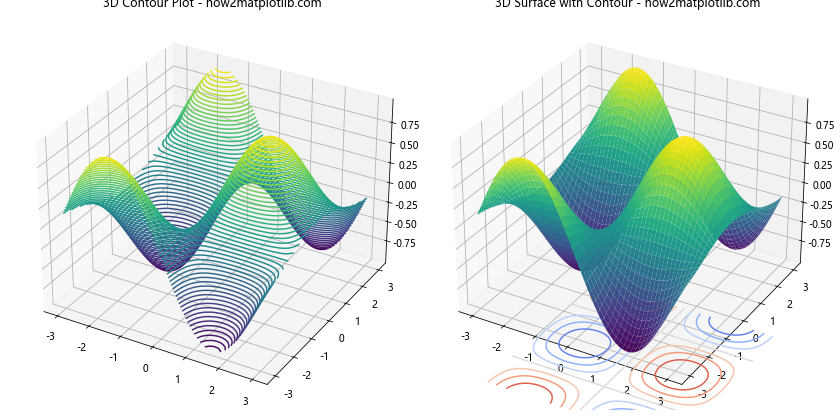
This example shows how to create a 3D contour plot and how to combine a 3D surface plot with a contour plot projected onto the base plane.
Handling Irregular Data in Matplotlib Contour Plots
Often, real-world data doesn’t come in a nice, regular grid. Let’s explore how to handle irregular data when creating matplotlib contour from points.
Triangulation-based Contour Plots
For irregularly spaced data, triangulation-based contour plots can be very useful:
import numpy as np
import matplotlib.pyplot as plt
from matplotlib.tri import Triangulation, UniformTriRefiner

# Generate some random data
np.random.seed(42)
npts = 200
ngridx = 100
ngridy = 200
x = np.random.uniform(-2, 2, npts)
y = np.random.uniform(-2, 2, npts)
z = x * np.exp(-x**2 - y**2)

# Create the Triangulation
triang = Triangulation(x, y)

# Refine data
refiner = UniformTriRefiner(triang)
tri_refi, z_test_refi = refiner.refine_field(z, subdiv=3)

# Plot the triangulation and the refined triangulation
fig, (ax1, ax2) = plt.subplots(ncols=2, figsize=(14, 6))

ax1.tricontourf(triang, z, levels=14, cmap='viridis')
ax1.tricontour(triang, z, levels=14, colors='k', linewidths=0.5)
ax1.set_title('Original Triangulation - how2matplotlib.com')

ax2.tricontourf(tri_refi, z_test_refi, levels=14, cmap='viridis')
ax2.tricontour(tri_refi, z_test_refi, levels=14, colors='k', linewidths=0.5)
ax2.set_title('Refined Triangulation - how2matplotlib.com')

plt.tight_layout()
plt.show()
Output:
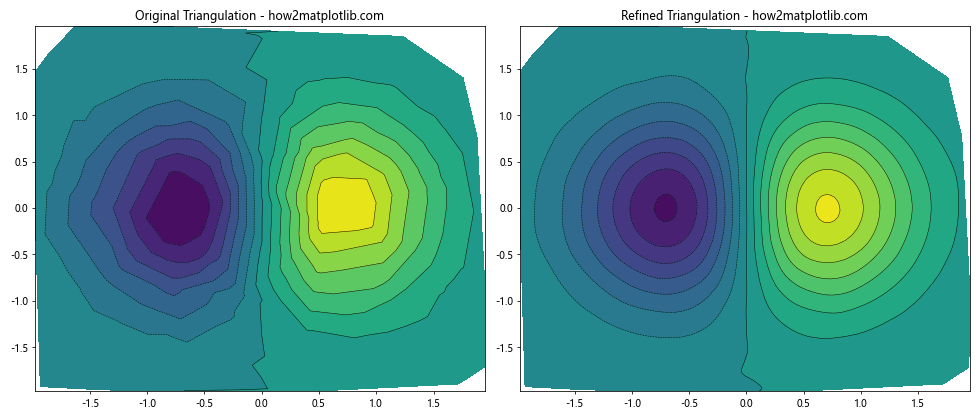
This example demonstrates how to create a contour plot from irregularly spaced data using triangulation. It also shows how to refine the triangulation for smoother contours.
Masked Contour Plots
Sometimes, you may want to exclude certain regions from your contour plot. This can be achieved using masked arrays:
import numpy as np
import matplotlib.pyplot as plt

# Create data
x = np.linspace(-3, 3, 100)
y = np.linspace(-3, 3, 100)
X, Y = np.meshgrid(x, y)
Z = np.sin(X) * np.cos(Y)

# Create a mask
mask = np.sqrt(X**2 + Y**2) > 2

# Apply the mask
Z_masked = np.ma.array(Z, mask=mask)

# Create the plot
fig, (ax1, ax2) = plt.subplots(ncols=2, figsize=(14, 6))

c1 = ax1.contourf(X, Y, Z, levels=20, cmap='viridis')
ax1.set_title('Original Contour Plot - how2matplotlib.com')

c2 = ax2.contourf(X, Y, Z_masked, levels=20, cmap='viridis')
ax2.set_title('Masked Contour Plot - how2matplotlib.com')

fig.colorbar(c1, ax=ax1, label='Z values')
fig.colorbar(c2, ax=ax2, label='Z values')

plt.tight_layout()
plt.show()
Output:
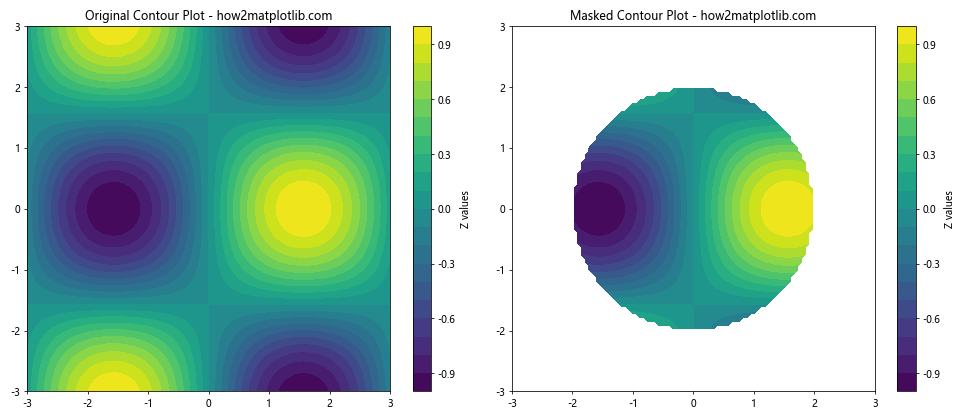
This example shows how to create a circular mask and apply it to a contour plot, excluding data outside a certain radius.
Customizing Contour Plot Appearance
Matplotlib contour from points offers extensive customization options. Let’s explore some ways to enhance the appearance of your contour plots.
Customizing Contour Lines
You can customize the appearance of contour lines in various ways:
import numpy as np
import matplotlib.pyplot as plt

x = np.linspace(-3, 3, 100)
y = np.linspace(-3, 3, 100)
X, Y = np.meshgrid(x, y)
Z = np.sin(X) * np.cos(Y)

plt.figure(figsize=(10, 8))

# Create filled contours
plt.contourf(X, Y, Z, levels=20, cmap='viridis', alpha=0.7)

# Add custom contour lines
cs = plt.contour(X, Y, Z, levels=10, colors='k', linewidths=0.5, linestyles='dashed')

# Label contour lines
plt.clabel(cs, inline=1, fontsize=8, fmt='%1.2f')

plt.colorbar(label='Z values')
plt.title('Customized Contour Plot - how2matplotlib.com')
plt.xlabel('X-axis')
plt.ylabel('Y-axis')
plt.show()
Output:
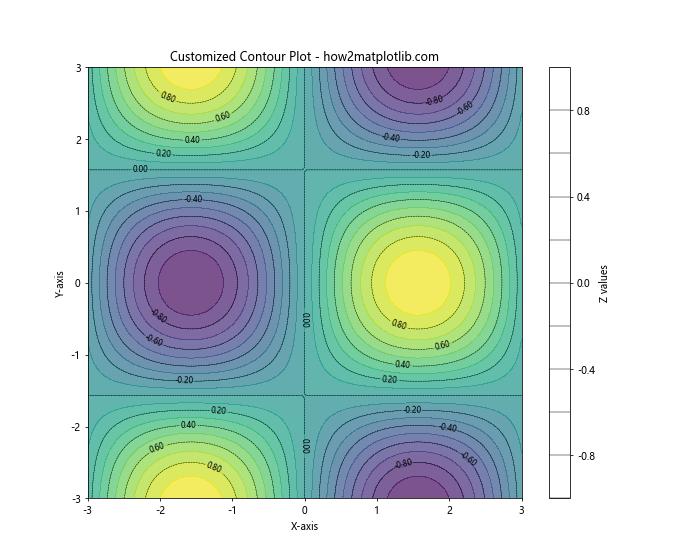
This example demonstrates how to customize contour line colors, widths, and styles, as well as how to add labels to the contour lines.
Adding a Color Bar
A color bar can greatly enhance the readability of your contour plot:
import numpy as np
import matplotlib.pyplot as plt

x = np.linspace(-3, 3, 100)
y = np.linspace(-3, 3, 100)
X, Y = np.meshgrid(x, y)
Z = np.sin(X) * np.cos(Y)

fig, (ax1, ax2) = plt.subplots(ncols=2, figsize=(14, 6))

# Default colorbar
c1 = ax1.contourf(X, Y, Z, levels=20, cmap='viridis')
fig.colorbar(c1, ax=ax1, label='Z values')
ax1.set_title('Default Colorbar - how2matplotlib.com')

# Customized colorbar
c2 = ax2.contourf(X, Y, Z, levels=20, cmap='coolwarm')
cbar = fig.colorbar(c2, ax=ax2, label='Z values', orientation='horizontal', pad=0.2)
cbar.ax.tick_params(labelsize=8)
cbar.set_ticks(np.linspace(Z.min(), Z.max(), 5))
cbar.set_ticklabels(['Very Low', 'Low', 'Medium', 'High', 'Very High'])
ax2.set_title('Customized Colorbar - how2matplotlib.com')

plt.tight_layout()
plt.show()
Output:
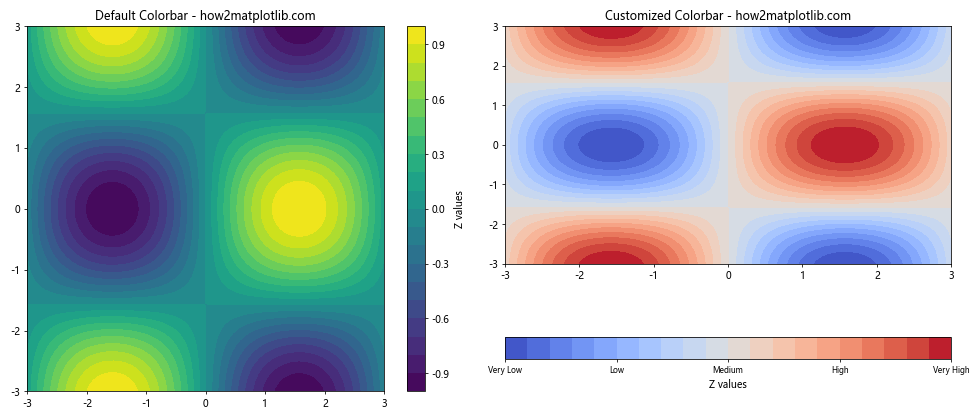
This example shows how to add a default color bar and how to customize its appearance and labels.
Advanced Matplotlib Contour Plot Applications
Let’s explore some more advanced applications of matplotlib contour from points.
Creating Contour Plots from Real-world Data
Here’s an example of creating a contour plot from real-world-like data:
import numpy as np
import matplotlib.pyplot as plt
from scipy.interpolate import griddata

# Generate some random "weather station" data
np.random.seed(42)
num_stations = 50
lats = np.random.uniform(30, 50, num_stations)
lons = np.random.uniform(-120, -70, num_stations)
temps = 15 + 10 * np.sin((lats - 40) / 10) + 5 * np.cos((lons + 95) / 25) + np.random.normal(0, 2, num_stations)

# Create a regular grid
grid_lats = np.linspace(30, 50, 100)
grid_lons = np.linspace(-120, -70, 100)
grid_lons, grid_lats = np.meshgrid(grid_lons, grid_lats)

# Interpolate the data onto the regular grid
grid_temps = griddata((lons, lats), temps, (grid_lons, grid_lats), method='cubic')

# Create the contour plot
plt.figure(figsize=(12, 8))
contour = plt.contourf(grid_lons, grid_lats, grid_temps, levels=20, cmap='RdYlBu_r')
plt.colorbar(contour, label='Temperature (°C)')
plt.scatter(lons, lats, c='k', s=10, label='Weather Stations')
plt.title('Temperature Contour Map - how2matplotlib.com')
plt.xlabel('Longitude')
plt.ylabel('Latitude')
plt.legend()
plt.show()
Output:
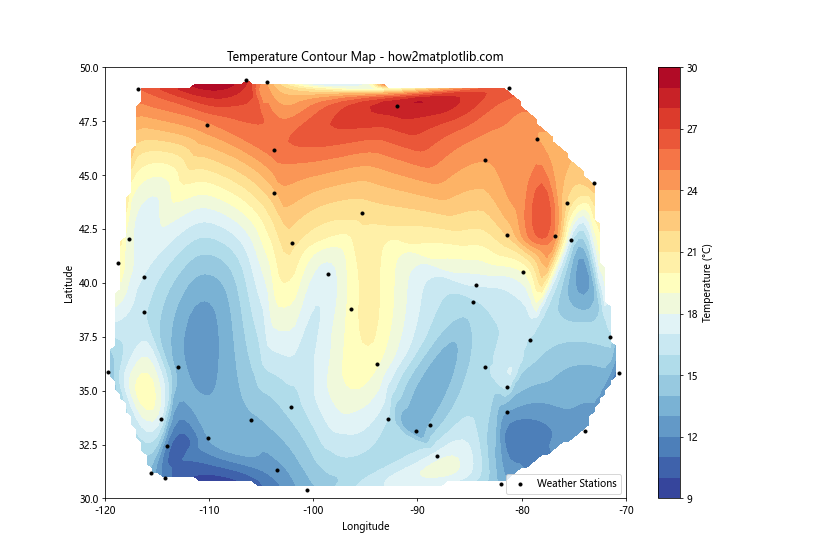
This example simulates temperature data from weather stations and creates a contour plot of temperatures across a geographic region.
Animated Contour Plots
Matplotlib contour from points can also be used to create animated visualizations:
import numpy as np
import matplotlib.pyplot as plt
from matplotlib.animation import FuncAnimation

def f(x, y, t):
    return np.sin(x + t) * np.cos(y + t)

x = np.linspace(-3, 3, 100)
y = np.linspace(-3, 3, 100)
X, Y = np.meshgrid(x, y)

fig, ax = plt.subplots(figsize=(8, 8))
contourf = ax.contourf(X, Y, f(X, Y, 0), levels=20, cmap='viridis')
ax.set_title('Animated Contour Plot - how2matplotlib.com')

def update(frame):
    ax.clear()
    contourf = ax.contourf(X, Y, f(X, Y, frame/10), levels=20, cmap='viridis')
    ax.set_title(f'Animated Contour Plot - Frame {frame} - how2matplotlib.com')
    return contourf

anim = FuncAnimation(fig, update, frames=100, interval=50)
plt.close()  # Prevent display of static plot
# anim.save('contour_animation.gif', writer='pillow')
This example creates an animated contour plot where the underlying function changes over time. Note that to actually see the animation, you’d need to save it or display it in an interactive environment.
Best Practices for Matplotlib Contour Plots
When creating matplotlib contour from points, there are several best practices to keep in mind:
- Data Preparation: Ensure your data is properly gridded or use appropriate interpolation techniques for scattered data.
Choose Appropriate Levels: Select contour levels that best represent your data’s distribution.
Color Selection: Use color maps that are appropriate for your data type (e.g., sequential for continuous data, diverging for data with a meaningful midpoint).
Labeling: Add clear labels to axes, titles, and color bars to make your plot easily interpretable.
Combine with Other Plot Types: Consider overlaying contour plots with other visualizations for more comprehensive data representation.
Here’s an example incorporating these best practices: