How to Create Stunning Matplotlib Dashed Lines: A Comprehensive Guide
Matplotlib dashed line is a powerful feature in data visualization that allows you to create visually appealing and informative plots. In this comprehensive guide, we’ll explore everything you need to know about creating and customizing dashed lines in Matplotlib. From basic usage to advanced techniques, we’ll cover it all, providing you with the tools to enhance your data visualizations using Matplotlib dashed lines.
Understanding Matplotlib Dashed Lines
Matplotlib dashed lines are a versatile way to represent data in plots, offering a distinct visual style that can help differentiate between different data series or highlight specific trends. By using dashed lines, you can create more engaging and informative visualizations that effectively communicate your data’s story.
Let’s start with a simple example of creating a Matplotlib dashed line:
import matplotlib.pyplot as plt
import numpy as np

x = np.linspace(0, 10, 100)
y = np.sin(x)

plt.figure(figsize=(8, 6))
plt.plot(x, y, linestyle='--', label='how2matplotlib.com')
plt.title('Simple Matplotlib Dashed Line')
plt.xlabel('X-axis')
plt.ylabel('Y-axis')
plt.legend()
plt.show()
Output:
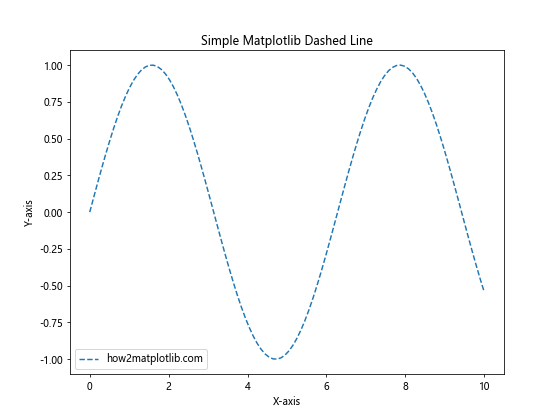
In this example, we create a simple sine wave plot using a Matplotlib dashed line. The linestyle='--' parameter sets the line style to dashed. This basic example demonstrates how easy it is to incorporate dashed lines into your Matplotlib plots.
Customizing Matplotlib Dashed Lines
One of the strengths of Matplotlib dashed lines is their customizability. You can adjust various properties of the dashed lines to suit your specific needs and preferences. Let’s explore some of these customization options:
Line Width
You can control the thickness of your Matplotlib dashed line using the linewidth parameter:
import matplotlib.pyplot as plt
import numpy as np

x = np.linspace(0, 10, 100)
y = np.cos(x)

plt.figure(figsize=(8, 6))
plt.plot(x, y, linestyle='--', linewidth=2, label='how2matplotlib.com')
plt.title('Matplotlib Dashed Line with Custom Width')
plt.xlabel('X-axis')
plt.ylabel('Y-axis')
plt.legend()
plt.show()
Output:
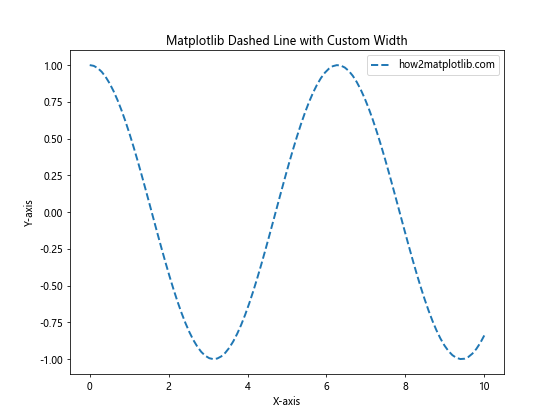
In this example, we set linewidth=2 to create a thicker dashed line. Experiment with different values to find the right thickness for your visualization.
Color
Changing the color of your Matplotlib dashed line is straightforward:
import matplotlib.pyplot as plt
import numpy as np

x = np.linspace(0, 10, 100)
y = np.tan(x)

plt.figure(figsize=(8, 6))
plt.plot(x, y, linestyle='--', color='red', label='how2matplotlib.com')
plt.title('Matplotlib Dashed Line with Custom Color')
plt.xlabel('X-axis')
plt.ylabel('Y-axis')
plt.legend()
plt.show()
Output:
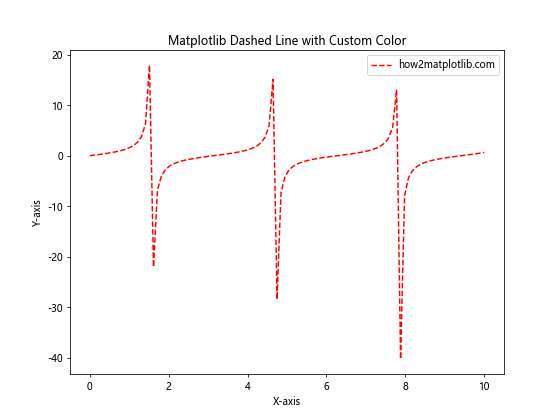
Here, we set color='red' to change the dashed line color to red. You can use any valid color name or RGB value to customize your Matplotlib dashed line color.
Dash Pattern
Matplotlib offers various dash patterns for your dashed lines. You can specify these patterns using a tuple of on/off lengths:
import matplotlib.pyplot as plt
import numpy as np

x = np.linspace(0, 10, 100)
y = np.exp(x)

plt.figure(figsize=(8, 6))
plt.plot(x, y, linestyle=(0, (5, 5)), label='how2matplotlib.com')
plt.title('Matplotlib Dashed Line with Custom Dash Pattern')
plt.xlabel('X-axis')
plt.ylabel('Y-axis')
plt.legend()
plt.show()
Output:
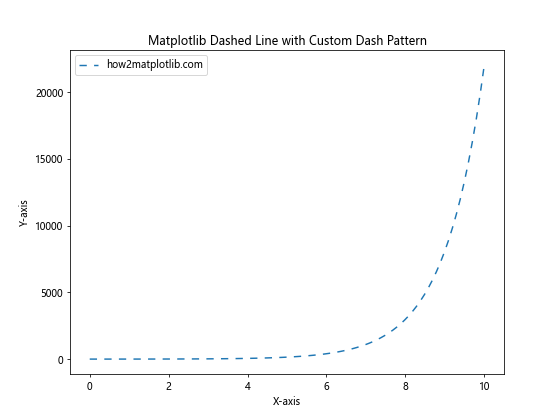
In this example, we use linestyle=(0, (5, 5)) to create a custom dash pattern. The first value (0) represents the offset, and the tuple (5, 5) represents the on and off lengths of the dashes.
Advanced Matplotlib Dashed Line Techniques
Now that we’ve covered the basics, let’s dive into some more advanced techniques for working with Matplotlib dashed lines.
Multiple Dashed Lines
You can easily plot multiple dashed lines on the same graph to compare different data series:
import matplotlib.pyplot as plt
import numpy as np

x = np.linspace(0, 10, 100)
y1 = np.sin(x)
y2 = np.cos(x)

plt.figure(figsize=(8, 6))
plt.plot(x, y1, linestyle='--', label='Sin - how2matplotlib.com')
plt.plot(x, y2, linestyle='-.', label='Cos - how2matplotlib.com')
plt.title('Multiple Matplotlib Dashed Lines')
plt.xlabel('X-axis')
plt.ylabel('Y-axis')
plt.legend()
plt.show()
Output:
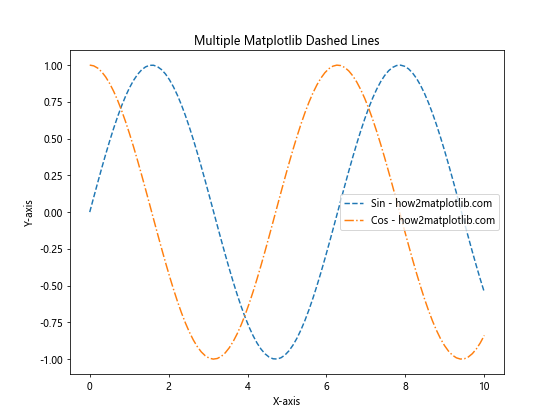
This example demonstrates how to plot two different dashed lines (using '--' and '-.' styles) on the same graph, allowing for easy comparison between sine and cosine functions.
Combining Solid and Dashed Lines
Mixing solid and dashed lines can be an effective way to highlight different aspects of your data:
import matplotlib.pyplot as plt
import numpy as np

x = np.linspace(0, 10, 100)
y1 = x**2
y2 = x**3

plt.figure(figsize=(8, 6))
plt.plot(x, y1, linestyle='-', label='x^2 - how2matplotlib.com')
plt.plot(x, y2, linestyle='--', label='x^3 - how2matplotlib.com')
plt.title('Combining Solid and Matplotlib Dashed Lines')
plt.xlabel('X-axis')
plt.ylabel('Y-axis')
plt.legend()
plt.show()
Output:
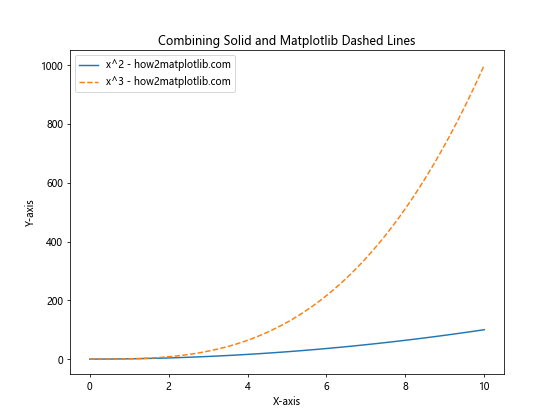
In this example, we use a solid line for y=x^2 and a dashed line for y=x^3, making it easy to distinguish between the two functions.
Dashed Lines in Subplots
Matplotlib dashed lines can be effectively used in subplots to create more complex visualizations:
import matplotlib.pyplot as plt
import numpy as np

x = np.linspace(0, 10, 100)
y1 = np.sin(x)
y2 = np.cos(x)

fig, (ax1, ax2) = plt.subplots(2, 1, figsize=(8, 10))

ax1.plot(x, y1, linestyle='--', label='Sin - how2matplotlib.com')
ax1.set_title('Subplot 1: Sin Function')
ax1.set_xlabel('X-axis')
ax1.set_ylabel('Y-axis')
ax1.legend()

ax2.plot(x, y2, linestyle='-.', label='Cos - how2matplotlib.com')
ax2.set_title('Subplot 2: Cos Function')
ax2.set_xlabel('X-axis')
ax2.set_ylabel('Y-axis')
ax2.legend()

plt.tight_layout()
plt.show()
Output:
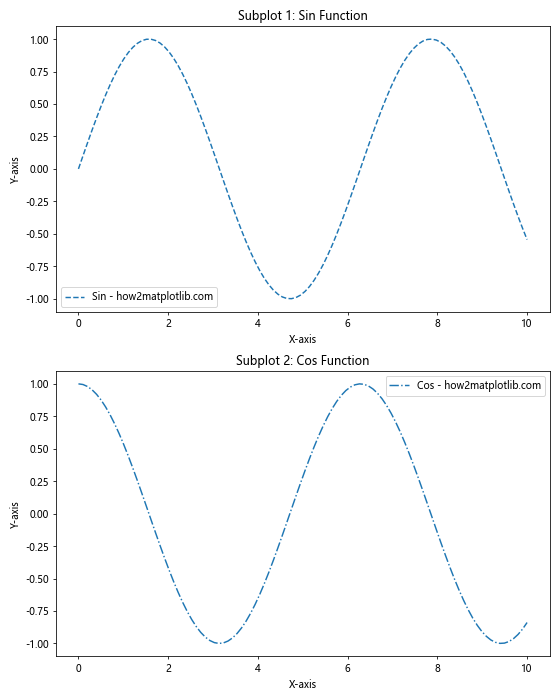
This example demonstrates how to create two subplots, each with a different Matplotlib dashed line style, allowing for a more comprehensive visualization of related data.
Matplotlib Dashed Lines in Different Plot Types
Matplotlib dashed lines can be used in various types of plots. Let’s explore some examples:
Scatter Plot with Dashed Trend Line
You can add a dashed trend line to a scatter plot to highlight the overall trend in your data:
import matplotlib.pyplot as plt
import numpy as np

x = np.linspace(0, 10, 50)
y = 2 * x + 1 + np.random.randn(50)

plt.figure(figsize=(8, 6))
plt.scatter(x, y, label='Data - how2matplotlib.com')
plt.plot(x, 2*x + 1, linestyle='--', color='red', label='Trend - how2matplotlib.com')
plt.title('Scatter Plot with Matplotlib Dashed Trend Line')
plt.xlabel('X-axis')
plt.ylabel('Y-axis')
plt.legend()
plt.show()
Output:
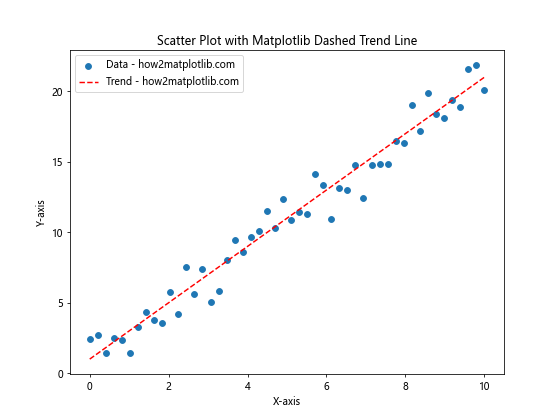
In this example, we create a scatter plot of noisy data and add a dashed trend line to show the underlying linear relationship.
Bar Plot with Dashed Average Line
You can use a Matplotlib dashed line to show the average value in a bar plot:
import matplotlib.pyplot as plt
import numpy as np

categories = ['A', 'B', 'C', 'D', 'E']
values = np.random.randint(1, 10, 5)
average = np.mean(values)

plt.figure(figsize=(8, 6))
plt.bar(categories, values, label='Values - how2matplotlib.com')
plt.axhline(y=average, linestyle='--', color='red', label='Average - how2matplotlib.com')
plt.title('Bar Plot with Matplotlib Dashed Average Line')
plt.xlabel('Categories')
plt.ylabel('Values')
plt.legend()
plt.show()
Output:
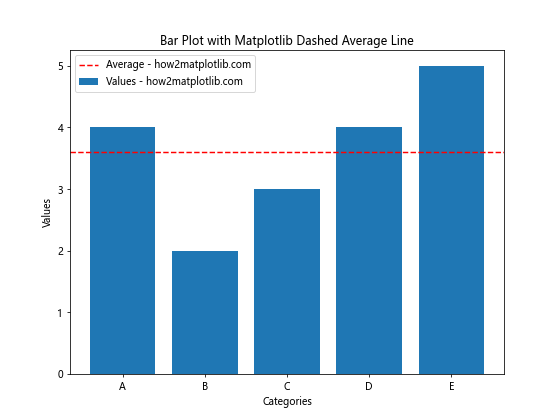
This example demonstrates how to add a dashed horizontal line representing the average value across a bar plot.
Customizing Matplotlib Dashed Lines for Specific Use Cases
Let’s explore some specific use cases where Matplotlib dashed lines can be particularly effective:
Time Series Data with Forecast
When working with time series data, you can use dashed lines to represent forecasts or projections:
import matplotlib.pyplot as plt
import numpy as np
import pandas as pd

dates = pd.date_range(start='2023-01-01', periods=100, freq='D')
values = np.cumsum(np.random.randn(100)) + 100
forecast = values[-1] + np.cumsum(np.random.randn(30))
forecast_dates = pd.date_range(start=dates[-1] + pd.Timedelta(days=1), periods=30, freq='D')

plt.figure(figsize=(12, 6))
plt.plot(dates, values, label='Actual - how2matplotlib.com')
plt.plot(forecast_dates, forecast, linestyle='--', label='Forecast - how2matplotlib.com')
plt.title('Time Series with Matplotlib Dashed Line Forecast')
plt.xlabel('Date')
plt.ylabel('Value')
plt.legend()
plt.show()
Output:
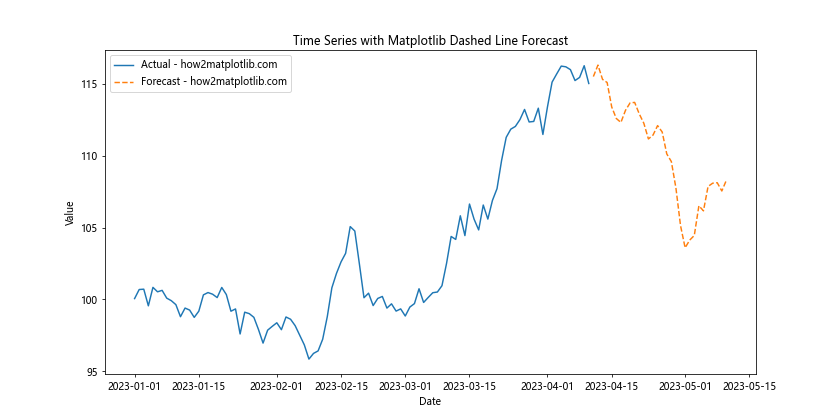
In this example, we use a solid line for historical data and a dashed line for the forecast, making it easy to distinguish between actual and projected values.
Confidence Intervals
Matplotlib dashed lines can be used to represent confidence intervals in statistical plots:
import matplotlib.pyplot as plt
import numpy as np

x = np.linspace(0, 10, 100)
y = 2 * x + 1 + np.random.randn(100) * 2
y_mean = 2 * x + 1
y_std = 2 * np.ones_like(x)

plt.figure(figsize=(10, 6))
plt.scatter(x, y, alpha=0.5, label='Data - how2matplotlib.com')
plt.plot(x, y_mean, label='Mean - how2matplotlib.com')
plt.plot(x, y_mean + y_std, linestyle='--', color='red', label='Upper CI - how2matplotlib.com')
plt.plot(x, y_mean - y_std, linestyle='--', color='red', label='Lower CI - how2matplotlib.com')
plt.title('Scatter Plot with Matplotlib Dashed Line Confidence Intervals')
plt.xlabel('X-axis')
plt.ylabel('Y-axis')
plt.legend()
plt.show()
Output:
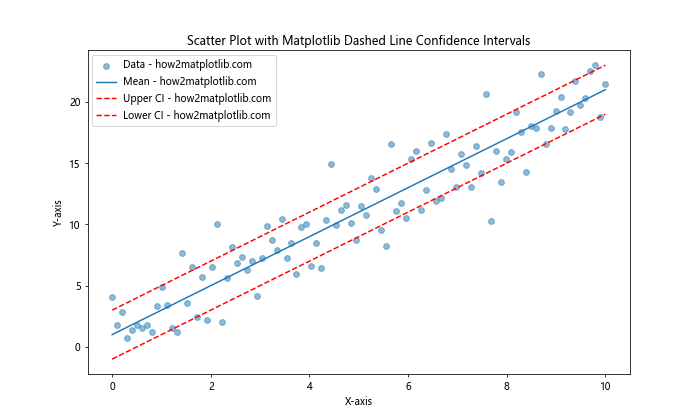
This example shows how to use dashed lines to represent the upper and lower bounds of a confidence interval around a mean trend line.
Best Practices for Using Matplotlib Dashed Lines
To make the most of Matplotlib dashed lines in your visualizations, consider the following best practices:
- Use dashed lines purposefully: Reserve dashed lines for specific elements in your plot, such as projections, averages, or secondary data series.
Maintain consistency: If you’re using multiple dashed lines in a single plot, ensure that each line style has a clear meaning and is used consistently throughout your visualization.
Consider color-blindness: When using different colors for dashed lines, ensure that your choices are accessible to color-blind viewers. You can use tools like ColorBrewer to select color-blind friendly palettes.
Provide clear legends: Always include a legend that explains what each dashed line represents in your plot.
Balance line thickness: Adjust the line width of your dashed lines to ensure they’re visible but not overpowering. This is especially important when combining dashed and solid lines.
Advanced Customization of Matplotlib Dashed Lines
For even more control over your Matplotlib dashed lines, you can use some advanced customization techniques: