How to Customize Matplotlib Boxplot X-Axis Labels: A Comprehensive Guide
Matplotlib boxplot x axis label customization is an essential skill for data visualization enthusiasts. In this comprehensive guide, we’ll explore various techniques to enhance your boxplot visualizations by focusing on x-axis label customization using Matplotlib. We’ll cover everything from basic label adjustments to advanced styling options, providing you with the tools to create professional-looking boxplots that effectively communicate your data insights.
Understanding Matplotlib Boxplot X-Axis Labels
Before diving into the customization techniques, it’s crucial to understand the role of x-axis labels in Matplotlib boxplots. The x-axis labels in a boxplot typically represent different categories or groups being compared. Properly formatted and positioned labels can significantly improve the readability and interpretability of your boxplots.
Let’s start with a basic example of creating a boxplot with default x-axis labels:
import matplotlib.pyplot as plt
import numpy as np

# Generate sample data
data = [np.random.normal(0, std, 100) for std in range(1, 4)]

# Create a boxplot
plt.figure(figsize=(10, 6))
plt.boxplot(data)
plt.title('Basic Boxplot - how2matplotlib.com')
plt.xlabel('Groups')
plt.ylabel('Values')
plt.show()
Output:
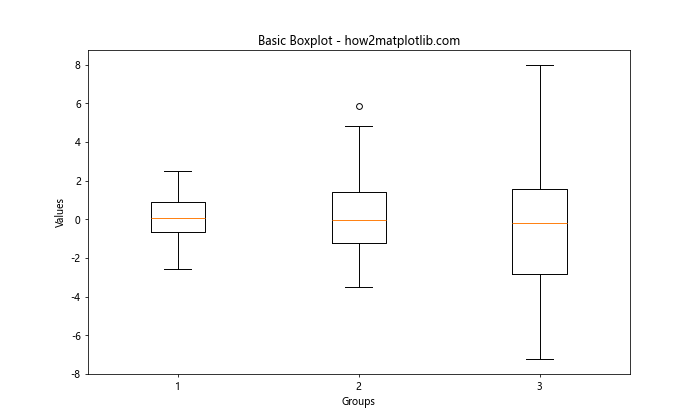
In this example, we create a simple boxplot with default x-axis labels. However, these default labels may not always be sufficient for effectively communicating your data. Let’s explore various ways to customize the matplotlib boxplot x axis label to enhance your visualizations.
Changing Matplotlib Boxplot X-Axis Label Text
One of the most basic customizations you can make to your matplotlib boxplot x axis label is changing the text of the labels. This is particularly useful when you want to provide more descriptive names for your data categories.
Here’s an example of how to change the x-axis label text:
import matplotlib.pyplot as plt
import numpy as np

# Generate sample data
data = [np.random.normal(0, std, 100) for std in range(1, 4)]

# Create a boxplot with custom x-axis labels
plt.figure(figsize=(10, 6))
plt.boxplot(data)
plt.title('Boxplot with Custom X-Axis Labels - how2matplotlib.com')
plt.xlabel('Groups')
plt.ylabel('Values')
plt.xticks([1, 2, 3], ['Group A', 'Group B', 'Group C'])
plt.show()
Output:
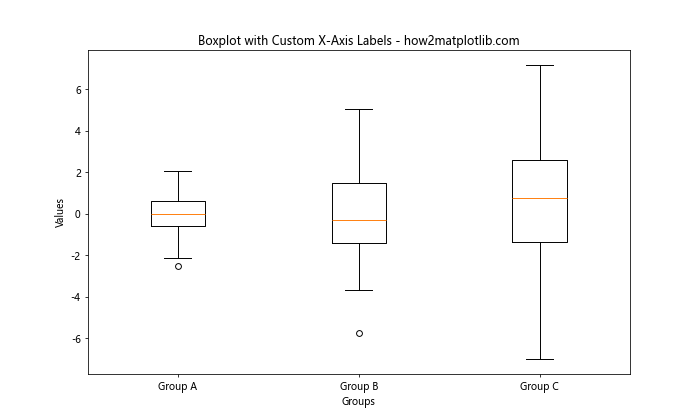
In this example, we use the plt.xticks() function to set custom labels for the x-axis. The first argument is a list of x-axis positions, and the second argument is a list of corresponding labels.
Rotating Matplotlib Boxplot X-Axis Labels
Sometimes, your x-axis labels may be too long or numerous, causing them to overlap. In such cases, rotating the labels can improve readability. Here’s how you can rotate the matplotlib boxplot x axis label:
import matplotlib.pyplot as plt
import numpy as np

# Generate sample data
data = [np.random.normal(0, std, 100) for std in range(1, 6)]

# Create a boxplot with rotated x-axis labels
plt.figure(figsize=(12, 6))
plt.boxplot(data)
plt.title('Boxplot with Rotated X-Axis Labels - how2matplotlib.com')
plt.xlabel('Long Group Names')
plt.ylabel('Values')
plt.xticks(range(1, 6), ['Very Long Group Name A', 'Very Long Group Name B', 'Very Long Group Name C', 'Very Long Group Name D', 'Very Long Group Name E'], rotation=45, ha='right')
plt.tight_layout()
plt.show()
Output:
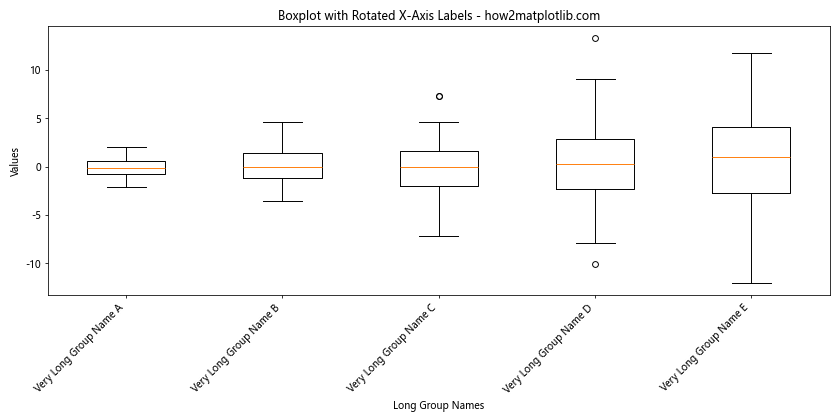
In this example, we’ve added the rotation=45 parameter to plt.xticks() to rotate the labels by 45 degrees. The ha='right' parameter aligns the labels to the right, which often looks better for rotated text.
Adjusting Matplotlib Boxplot X-Axis Label Font Size
Customizing the font size of your matplotlib boxplot x axis label can help emphasize certain aspects of your visualization or improve overall readability. Here’s how you can adjust the font size:
import matplotlib.pyplot as plt
import numpy as np

# Generate sample data
data = [np.random.normal(0, std, 100) for std in range(1, 4)]

# Create a boxplot with custom x-axis label font size
plt.figure(figsize=(10, 6))
plt.boxplot(data)
plt.title('Boxplot with Custom X-Axis Label Font Size - how2matplotlib.com')
plt.xlabel('Groups')
plt.ylabel('Values')
plt.xticks([1, 2, 3], ['Group A', 'Group B', 'Group C'], fontsize=14)
plt.show()
Output:
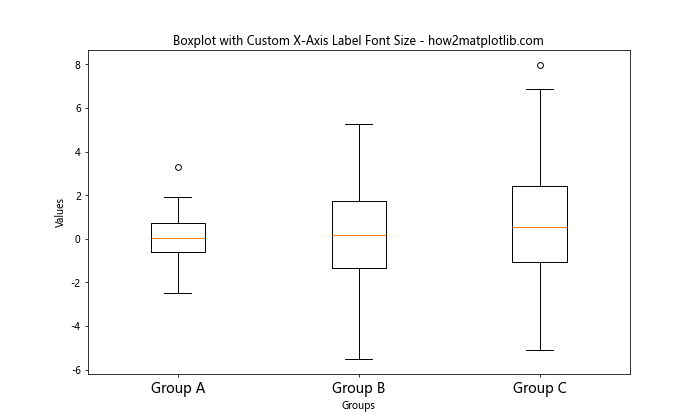
In this example, we’ve added the fontsize=14 parameter to plt.xticks() to increase the font size of the x-axis labels.
Changing Matplotlib Boxplot X-Axis Label Color
Adding color to your matplotlib boxplot x axis label can help them stand out or match your overall color scheme. Here’s how you can change the color of your x-axis labels:
import matplotlib.pyplot as plt
import numpy as np

# Generate sample data
data = [np.random.normal(0, std, 100) for std in range(1, 4)]

# Create a boxplot with colored x-axis labels
plt.figure(figsize=(10, 6))
plt.boxplot(data)
plt.title('Boxplot with Colored X-Axis Labels - how2matplotlib.com')
plt.xlabel('Groups')
plt.ylabel('Values')
plt.xticks([1, 2, 3], ['Group A', 'Group B', 'Group C'], color='red')
plt.show()
Output:
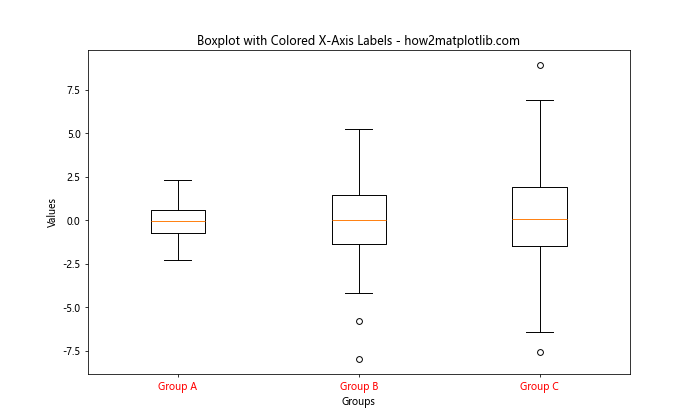
In this example, we’ve added the color='red' parameter to plt.xticks() to change the color of the x-axis labels to red.
Using Custom Fonts for Matplotlib Boxplot X-Axis Labels
To give your visualization a unique look, you might want to use custom fonts for your matplotlib boxplot x axis label. Here’s how you can do that:
import matplotlib.pyplot as plt
import numpy as np
from matplotlib import font_manager

# Add a custom font
font_path = '/path/to/your/font.ttf'  # Replace with the path to your font file
font_manager.fontManager.addfont(font_path)
plt.rcParams['font.family'] = 'Your Font Name'  # Replace with your font name

# Generate sample data
data = [np.random.normal(0, std, 100) for std in range(1, 4)]

# Create a boxplot with custom font x-axis labels
plt.figure(figsize=(10, 6))
plt.boxplot(data)
plt.title('Boxplot with Custom Font X-Axis Labels - how2matplotlib.com')
plt.xlabel('Groups')
plt.ylabel('Values')
plt.xticks([1, 2, 3], ['Group A', 'Group B', 'Group C'])
plt.show()
In this example, we first add a custom font using font_manager.fontManager.addfont() and then set it as the default font family using plt.rcParams['font.family']. Make sure to replace the font path and name with your desired font.
Adding Matplotlib Boxplot X-Axis Label Annotations
Sometimes, you might want to add additional information to your matplotlib boxplot x axis label. Annotations can be a great way to achieve this. Here’s an example:
import matplotlib.pyplot as plt
import numpy as np

# Generate sample data
data = [np.random.normal(0, std, 100) for std in range(1, 4)]

# Create a boxplot with annotated x-axis labels
plt.figure(figsize=(12, 6))
plt.boxplot(data)
plt.title('Boxplot with Annotated X-Axis Labels - how2matplotlib.com')
plt.xlabel('Groups')
plt.ylabel('Values')
plt.xticks([1, 2, 3], ['Group A', 'Group B', 'Group C'])

# Add annotations
for i, label in enumerate(['n=100', 'n=100', 'n=100']):
    plt.annotate(label, (i+1, plt.gca().get_ylim()[0]), xytext=(0, -20),
                 textcoords='offset points', ha='center', va='top')

plt.tight_layout()
plt.show()
Output:
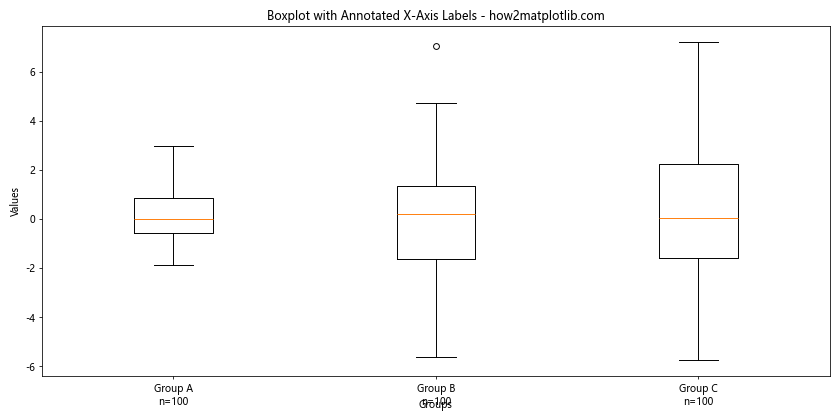
In this example, we use plt.annotate() to add sample size information below each x-axis label.
Customizing Matplotlib Boxplot X-Axis Label Tick Marks
The tick marks on your x-axis can also be customized to enhance your matplotlib boxplot x axis label. Here’s how you can modify the tick marks:
import matplotlib.pyplot as plt
import numpy as np

# Generate sample data
data = [np.random.normal(0, std, 100) for std in range(1, 4)]

# Create a boxplot with custom x-axis tick marks
plt.figure(figsize=(10, 6))
plt.boxplot(data)
plt.title('Boxplot with Custom X-Axis Tick Marks - how2matplotlib.com')
plt.xlabel('Groups')
plt.ylabel('Values')
plt.xticks([1, 2, 3], ['Group A', 'Group B', 'Group C'])

# Customize tick marks
ax = plt.gca()
ax.tick_params(axis='x', which='major', length=10, width=2, color='red')

plt.show()
Output:
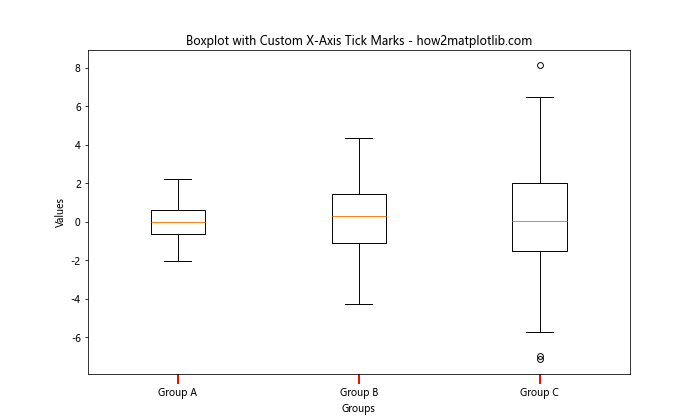
In this example, we use ax.tick_params() to modify the length, width, and color of the x-axis tick marks.
Adding a Secondary X-Axis with Different Labels
In some cases, you might want to add a secondary x-axis with different labels to provide additional context. Here’s how you can achieve this:
import matplotlib.pyplot as plt
import numpy as np

# Generate sample data
data = [np.random.normal(0, std, 100) for std in range(1, 4)]

# Create a boxplot with a secondary x-axis
fig, ax1 = plt.subplots(figsize=(10, 6))
ax1.boxplot(data)
ax1.set_title('Boxplot with Secondary X-Axis - how2matplotlib.com')
ax1.set_xlabel('Primary Groups')
ax1.set_ylabel('Values')
ax1.set_xticks([1, 2, 3])
ax1.set_xticklabels(['Group A', 'Group B', 'Group C'])

# Add secondary x-axis
ax2 = ax1.twiny()
ax2.set_xticks([1, 2, 3])
ax2.set_xticklabels(['Category X', 'Category Y', 'Category Z'])
ax2.set_xlabel('Secondary Categories')

plt.tight_layout()
plt.show()
Output:
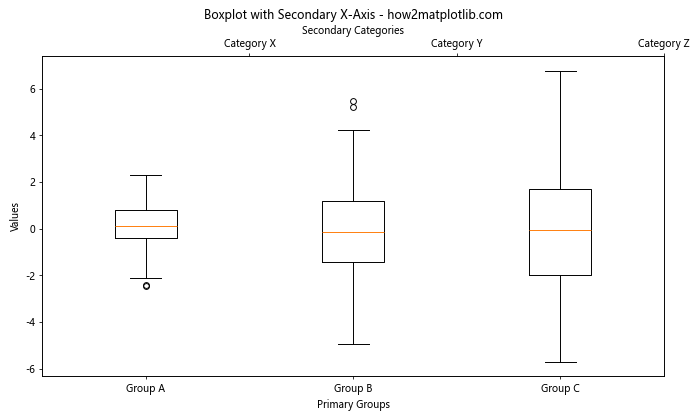
In this example, we create a secondary x-axis using ax1.twiny() and set its labels and ticks separately.
Using LaTeX Formatting in Matplotlib Boxplot X-Axis Labels
For scientific or mathematical visualizations, you might want to use LaTeX formatting in your matplotlib boxplot x axis label. Here’s how you can do that:
import matplotlib.pyplot as plt
import numpy as np

# Enable LaTeX rendering
plt.rcParams['text.usetex'] = True

# Generate sample data
data = [np.random.normal(0, std, 100) for std in range(1, 4)]

# Create a boxplot with LaTeX-formatted x-axis labels
plt.figure(figsize=(10, 6))
plt.boxplot(data)
plt.title('Boxplot with LaTeX X-Axis Labels - how2matplotlib.com')
plt.xlabel('Groups')
plt.ylabel('Values')
plt.xticks([1, 2, 3], [r'$\alpha$', r'$\beta$', r'$\gamma$'])
plt.show()
In this example, we enable LaTeX rendering with plt.rcParams['text.usetex'] = True and then use LaTeX syntax for the x-axis labels.
Creating a Grouped Boxplot with Custom X-Axis Labels
When dealing with more complex data structures, you might need to create grouped boxplots. Here’s how you can customize the x-axis labels for a grouped boxplot:
import matplotlib.pyplot as plt
import numpy as np

# Generate sample data
np.random.seed(42)
data = {
    'Group A': np.random.normal(100, 10, 200),
    'Group B': np.random.normal(80, 20, 200),
    'Group C': np.random.normal(90, 15, 200)
}

categories = ['Category 1', 'Category 2']

# Create a grouped boxplot with custom x-axis labels
fig, ax = plt.subplots(figsize=(12, 6))

positions = np.arange(len(categories))
width = 0.25

for i, (group, values) in enumerate(data.items()):
    bp = ax.boxplot([values[:100], values[100:]], positions=positions + i*width, widths=width, patch_artist=True)
    plt.setp(bp['boxes'], facecolor=f'C{i}')

ax.set_title('Grouped Boxplot with Custom X-Axis Labels - how2matplotlib.com')
ax.set_xlabel('Categories')
ax.set_ylabel('Values')
ax.set_xticks(positions + width)
ax.set_xticklabels(categories)

ax.legend(data.keys(), loc='upper right')

plt.tight_layout()
plt.show()
Output:
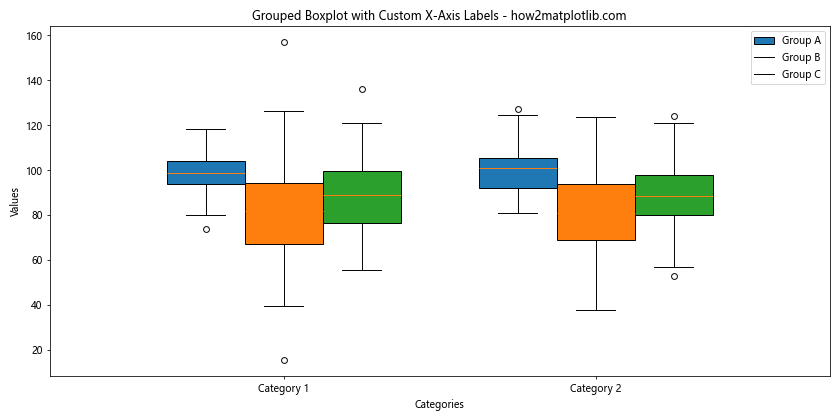
In this example, we create a grouped boxplot with custom x-axis labels for different categories and groups.
Adding Vertical Lines to Separate Matplotlib Boxplot X-Axis Labels
To visually separate different groups in your boxplot, you might want to add vertical lines between the matplotlib boxplot x axis label. Here’s how you can do that:
import matplotlib.pyplot as plt
import numpy as np

# Generate sample data
data = [np.random.normal(0, std, 100) for std in range(1, 6)]

# Create a boxplot with vertical lines separating x-axis labels
fig, ax = plt.subplots(figsize=(12, 6))
ax.boxplot(data)
ax.set_title('Boxplot with Vertical Lines Separating X-Axis Labels - how2matplotlib.com')
ax.set_xlabel('Groups')
ax.set_ylabel('Values')
ax.set_xticks(range(1, 6))
ax.set_xticklabels(['Group A', 'Group B', 'Group C', 'Group D', 'Group E'])

# Add vertical lines
for x in range(1, 6):
    ax.axvline(x + 0.5, color='gray', linestyle='--', alpha=0.5)

plt.tight_layout()
plt.show()
Output:
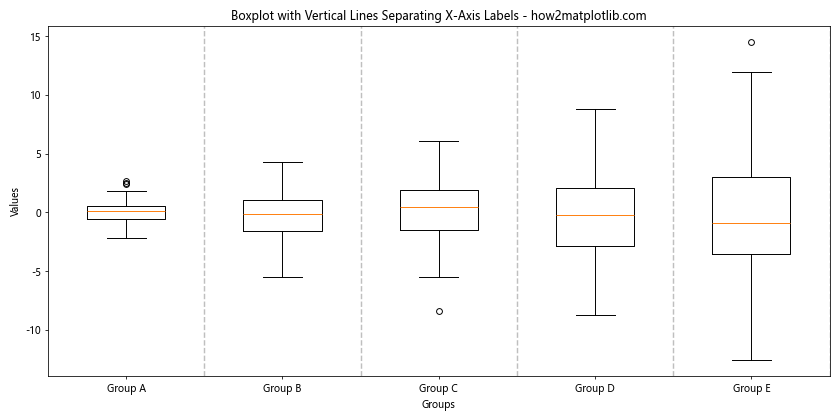
In this example, we use ax.axvline() to add vertical lines between each group in the boxplot.
Using Gradient Colors for Matplotlib Boxplot X-Axis Labels
To add a visually appealing touch to your matplotlib boxplot x axis label, you can use gradient colors. Here’s how you can achieve this effect:
import matplotlib.pyplot as plt
import numpy as np
from matplotlib.colors import LinearSegmentedColormap

# Generate sample data
data = [np.random.normal(0, std, 100) for std in range(1, 6)]

# Create a custom colormap
colors = ['#FF6B6B', '#4ECDC4']
n_bins = 5
cmap = LinearSegmentedColormap.from_list('custom', colors, N=n_bins)

# Create a boxplot with gradient-colored x-axis labels
fig, ax = plt.subplots(figsize=(12, 6))
ax.boxplot(data)
ax.set_title('Boxplot with Gradient-Colored X-Axis Labels - how2matplotlib.com')
ax.set_xlabel('Groups')
ax.set_ylabel('Values')
ax.set_xticks(range(1, 6))
ax.set_xticklabels(['Group A', 'Group B', 'Group C', 'Group D', 'Group E'])

# Apply gradient colors to x-axis labels
for i, label in enumerate(ax.get_xticklabels()):
    label.set_color(cmap(i / (n_bins - 1)))

plt.tight_layout()
plt.show()
Output:
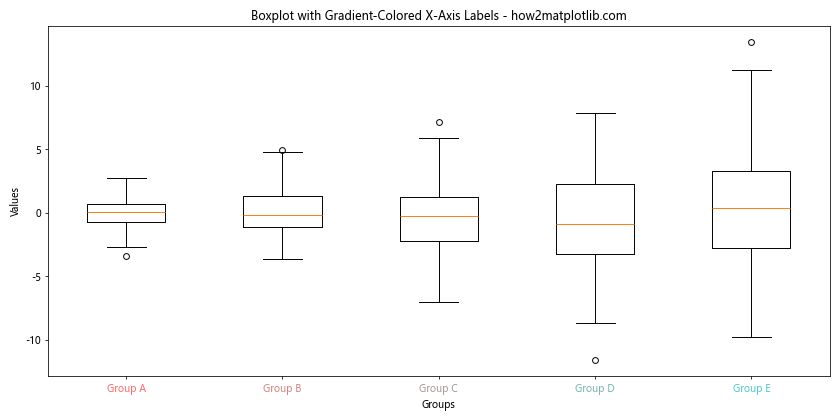
In this example, we create a custom colormap using LinearSegmentedColormap.from_list() and apply it to the x-axis labels using a loop.
Adding Icons to Matplotlib Boxplot X-Axis Labels
To make your matplotlib boxplot x axis label more visually interesting, you can add icons or symbols. Here’s an example using Unicode characters:
import matplotlib.pyplot as plt
import numpy as np

# Generate sample data
data = [np.random.normal(0, std, 100) for std in range(1, 4)]

# Create a boxplot with icons in x-axis labels
plt.figure(figsize=(10, 6))
plt.boxplot(data)
plt.title('Boxplot with Icons in X-Axis Labels - how2matplotlib.com')
plt.xlabel('Groups')
plt.ylabel('Values')
plt.xticks([1, 2, 3], ['🍎 Group A', '🍐 Group B', '🍊 Group C'])
plt.show()
Output:
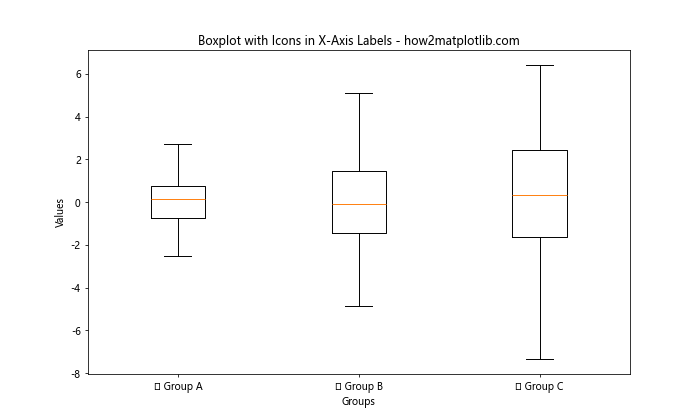
In this example, we use Unicode emoji characters to add fruit icons to our x-axis labels. Note that the appearance of these icons may vary depending on the system and font support.
Creating a Circular Boxplot with Custom X-Axis Labels
For a unique visualization, you can create a circular boxplot with custom matplotlib boxplot x axis label. Here’s how you can achieve this:
import matplotlib.pyplot as plt
import numpy as np

def polar_boxplot(data, labels):
    fig, ax = plt.subplots(figsize=(10, 10), subplot_kw=dict(projection='polar'))

    # Convert data to polar coordinates
    theta = np.linspace(0, 2*np.pi, len(data), endpoint=False)
    width = 2*np.pi / len(data)

    # Create boxplots
    bps = ax.boxplot(data, positions=theta, widths=width, patch_artist=True)

    # Customize boxplots
    for patch in bps['boxes']:
        patch.set_facecolor('lightblue')

    # Set custom x-axis labels
    ax.set_xticks(theta)
    ax.set_xticklabels(labels)

    # Remove radial labels and adjust layout
    ax.set_yticks([])
    ax.set_ylim(0, 1)
    plt.title('Circular Boxplot with Custom X-Axis Labels - how2matplotlib.com')
    plt.tight_layout()
    plt.show()

# Generate sample data
np.random.seed(42)
data = [np.random.normal(0, std, 100) for std in range(1, 7)]
labels = ['Group A', 'Group B', 'Group C', 'Group D', 'Group E', 'Group F']

# Create circular boxplot
polar_boxplot(data, labels)
In this example, we create a custom function polar_boxplot() that transforms a regular boxplot into a circular one using polar coordinates. The x-axis labels are placed around the circumference of the plot.
Using Matplotlib Boxplot X-Axis Labels for Time Series Data
When working with time series data, you might want to use dates as your matplotlib boxplot x axis label. Here’s how you can achieve this:
import matplotlib.pyplot as plt
import numpy as np
import pandas as pd

# Generate sample time series data
dates = pd.date_range(start='2023-01-01', end='2023-12-31', freq='M')
data = [np.random.normal(0, std, 100) for std in range(1, 13)]

# Create a boxplot with date x-axis labels
fig, ax = plt.subplots(figsize=(14, 6))
ax.boxplot(data)
ax.set_title('Boxplot with Date X-Axis Labels - how2matplotlib.com')
ax.set_xlabel('Months')
ax.set_ylabel('Values')

# Set date labels
ax.set_xticks(range(1, 13))
ax.set_xticklabels([date.strftime('%b %Y') for date in dates], rotation=45, ha='right')

plt.tight_layout()
plt.show()
Output:
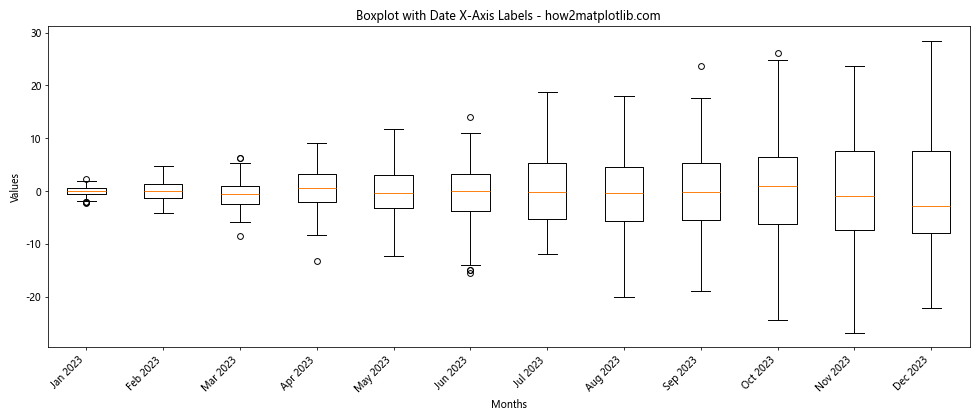
In this example, we use pandas to generate a range of dates and format them as month-year strings for our x-axis labels.
Creating an Interactive Matplotlib Boxplot with Hoverable X-Axis Labels
To enhance user interaction, you can create an interactive matplotlib boxplot with hoverable x-axis labels using the mpld3 library. Here’s an example:
import matplotlib.pyplot as plt
import numpy as np
import mpld3

# Generate sample data
data = [np.random.normal(0, std, 100) for std in range(1, 4)]

# Create an interactive boxplot
fig, ax = plt.subplots(figsize=(10, 6))
bp = ax.boxplot(data)
ax.set_title('Interactive Boxplot with Hoverable X-Axis Labels - how2matplotlib.com')
ax.set_xlabel('Groups')
ax.set_ylabel('Values')
ax.set_xticks([1, 2, 3])
ax.set_xticklabels(['Group A', 'Group B', 'Group C'])

# Add interactivity
tooltip_text = ['Group A: First experimental group',
                'Group B: Second experimental group',
                'Group C: Control group']

for i, label in enumerate(ax.get_xticklabels()):
    tooltip = mpld3.plugins.LineLabelTooltip(bp['medians'][i], label.get_text(), tooltip_text[i])
    mpld3.plugins.connect(fig, tooltip)

# Display the plot
mpld3.show()
In this example, we use the mpld3 library to add tooltips to the x-axis labels. When a user hovers over a median line, they’ll see additional information about the group.
Matplotlib boxplot x axis label Conclusion
Mastering matplotlib boxplot x axis label customization is crucial for creating clear, informative, and visually appealing data visualizations. Throughout this comprehensive guide, we’ve explored various techniques to enhance your boxplots, from basic label adjustments to advanced styling options and even interactive features.
By applying these methods, you can significantly improve the readability and interpretability of your boxplots, making it easier for your audience to understand the insights presented in your data. Remember that the key to effective data visualization is finding the right balance between aesthetics and clarity.