How to Master Matplotlib Textbox Widgets
Matplotlib Textbox Widgets are powerful tools for creating interactive visualizations in Python. These widgets allow users to input text directly into a plot, enabling dynamic updates and real-time data manipulation. In this comprehensive guide, we’ll explore the various aspects of Matplotlib Textbox Widgets, from basic implementation to advanced techniques. By the end of this article, you’ll have a thorough understanding of how to leverage these widgets to enhance your data visualization projects.
Understanding Matplotlib Textbox Widgets
Matplotlib Textbox Widgets are interactive elements that can be added to Matplotlib plots. They provide a way for users to input text directly into the plot, which can then be used to update the visualization or perform other actions. These widgets are part of the matplotlib.widgets
module and offer a range of customization options to suit different needs.
Let’s start with a simple example to illustrate how to create a basic Matplotlib Textbox Widget:
import matplotlib.pyplot as plt
from matplotlib.widgets import TextBox
fig, ax = plt.subplots()
ax.set_title("Matplotlib Textbox Widget Example - how2matplotlib.com")
initial_text = ""
textbox = TextBox(ax.inset_axes([0.1, 0.05, 0.8, 0.075]), "Enter text:", initial=initial_text)
def submit(text):
ax.clear()
ax.set_title("Matplotlib Textbox Widget Example - how2matplotlib.com")
ax.text(0.5, 0.5, f"You entered: {text}", ha='center', va='center')
plt.draw()
textbox.on_submit(submit)
plt.show()
Output:
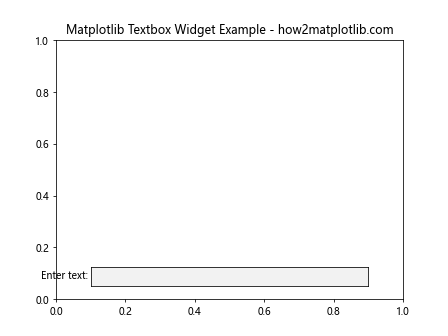
In this example, we create a simple Matplotlib plot with a Textbox Widget. The widget is positioned at the bottom of the plot using inset_axes
. When the user enters text and presses Enter, the submit
function is called, which updates the plot with the entered text.
Customizing Matplotlib Textbox Widgets
Matplotlib Textbox Widgets offer various customization options to tailor their appearance and behavior. Let’s explore some of these options:
Changing the Textbox Color
You can customize the color of the Textbox Widget to match your plot’s theme:
import matplotlib.pyplot as plt
from matplotlib.widgets import TextBox
fig, ax = plt.subplots()
ax.set_title("Customized Matplotlib Textbox Widget - how2matplotlib.com")
textbox = TextBox(ax.inset_axes([0.1, 0.05, 0.8, 0.075]), "Enter text:",
initial="how2matplotlib.com",
color='lightblue', hovercolor='lightgreen')
def submit(text):
ax.clear()
ax.set_title("Customized Matplotlib Textbox Widget - how2matplotlib.com")
ax.text(0.5, 0.5, f"You entered: {text}", ha='center', va='center')
plt.draw()
textbox.on_submit(submit)
plt.show()
Output:
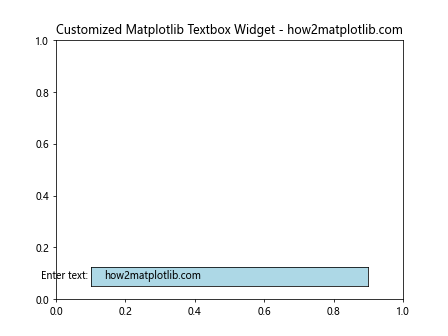
In this example, we set the color
and hovercolor
properties of the Textbox Widget to customize its appearance.
Adjusting Textbox Size and Position
You can control the size and position of the Textbox Widget within the plot:
import matplotlib.pyplot as plt
from matplotlib.widgets import TextBox
fig, ax = plt.subplots()
ax.set_title("Resized Matplotlib Textbox Widget - how2matplotlib.com")
textbox = TextBox(ax.inset_axes([0.2, 0.8, 0.6, 0.1]), "Enter text:",
initial="how2matplotlib.com")
def submit(text):
ax.clear()
ax.set_title("Resized Matplotlib Textbox Widget - how2matplotlib.com")
ax.text(0.5, 0.5, f"You entered: {text}", ha='center', va='center')
plt.draw()
textbox.on_submit(submit)
plt.show()
Output:
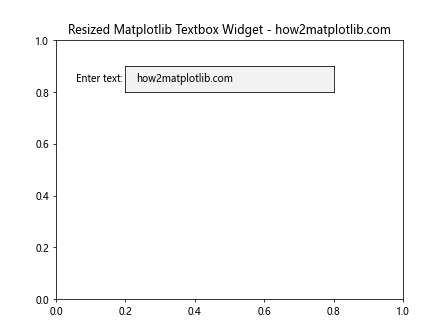
Here, we’ve adjusted the position and size of the Textbox Widget by modifying the parameters of inset_axes
.
Handling User Input with Matplotlib Textbox Widgets
One of the key features of Matplotlib Textbox Widgets is their ability to handle user input. Let’s explore different ways to process and respond to user input:
Real-time Updates
You can update the plot in real-time as the user types:
import matplotlib.pyplot as plt
from matplotlib.widgets import TextBox
fig, ax = plt.subplots()
ax.set_title("Real-time Matplotlib Textbox Widget - how2matplotlib.com")
textbox = TextBox(ax.inset_axes([0.1, 0.05, 0.8, 0.075]), "Enter text:",
initial="how2matplotlib.com")
def update(text):
ax.clear()
ax.set_title("Real-time Matplotlib Textbox Widget - how2matplotlib.com")
ax.text(0.5, 0.5, f"Current text: {text}", ha='center', va='center')
plt.draw()
textbox.on_text_change(update)
plt.show()
Output:
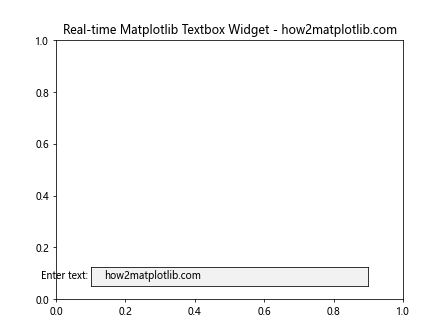
In this example, we use the on_text_change
method to update the plot every time the text in the Textbox Widget changes.
Numeric Input Validation
You can validate numeric input and use it to update the plot:
import matplotlib.pyplot as plt
from matplotlib.widgets import TextBox
import numpy as np
fig, ax = plt.subplots()
ax.set_title("Numeric Input Matplotlib Textbox Widget - how2matplotlib.com")
x = np.linspace(0, 10, 100)
line, = ax.plot(x, np.sin(x))
textbox = TextBox(ax.inset_axes([0.1, 0.05, 0.8, 0.075]), "Frequency:",
initial="1")
def update(text):
try:
freq = float(text)
line.set_ydata(np.sin(freq * x))
plt.draw()
except ValueError:
pass
textbox.on_submit(update)
plt.show()
Output:
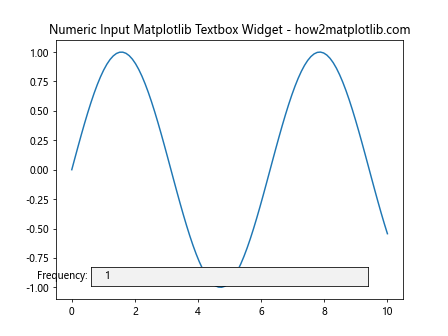
This example demonstrates how to use a Textbox Widget to adjust the frequency of a sine wave in real-time.
Advanced Techniques with Matplotlib Textbox Widgets
Now that we’ve covered the basics, let’s explore some advanced techniques for working with Matplotlib Textbox Widgets:
Multiple Textbox Widgets
You can use multiple Textbox Widgets to control different aspects of your plot:
import matplotlib.pyplot as plt
from matplotlib.widgets import TextBox
import numpy as np
fig, ax = plt.subplots()
ax.set_title("Multiple Matplotlib Textbox Widgets - how2matplotlib.com")
x = np.linspace(0, 10, 100)
line, = ax.plot(x, np.sin(x))
freq_textbox = TextBox(ax.inset_axes([0.1, 0.05, 0.3, 0.075]), "Frequency:",
initial="1")
amp_textbox = TextBox(ax.inset_axes([0.6, 0.05, 0.3, 0.075]), "Amplitude:",
initial="1")
def update(val):
try:
freq = float(freq_textbox.text)
amp = float(amp_textbox.text)
line.set_ydata(amp * np.sin(freq * x))
plt.draw()
except ValueError:
pass
freq_textbox.on_submit(update)
amp_textbox.on_submit(update)
plt.show()
Output:
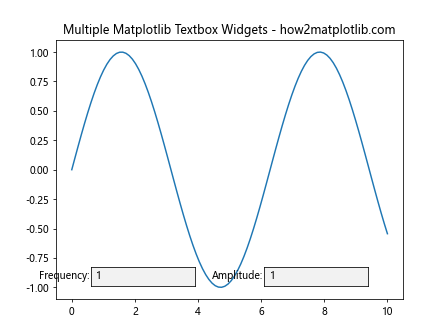
This example uses two Textbox Widgets to control both the frequency and amplitude of a sine wave.
Combining Textbox Widgets with Other Widgets
You can combine Textbox Widgets with other Matplotlib widgets for more complex interactions:
import matplotlib.pyplot as plt
from matplotlib.widgets import TextBox, Button
import numpy as np
fig, ax = plt.subplots()
ax.set_title("Combined Matplotlib Widgets - how2matplotlib.com")
x = np.linspace(0, 10, 100)
line, = ax.plot(x, np.sin(x))
textbox = TextBox(ax.inset_axes([0.1, 0.05, 0.3, 0.075]), "Frequency:",
initial="1")
button = Button(ax.inset_axes([0.6, 0.05, 0.3, 0.075]), "Reset")
def update(text):
try:
freq = float(text)
line.set_ydata(np.sin(freq * x))
plt.draw()
except ValueError:
pass
def reset(event):
textbox.set_val("1")
line.set_ydata(np.sin(x))
plt.draw()
textbox.on_submit(update)
button.on_clicked(reset)
plt.show()
Output:
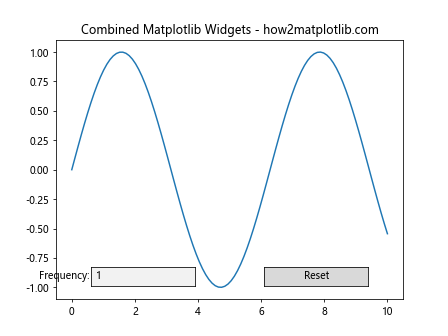
This example combines a Textbox Widget with a Button Widget to allow users to adjust the frequency of a sine wave and reset it to the default value.
Best Practices for Using Matplotlib Textbox Widgets
When working with Matplotlib Textbox Widgets, it’s important to follow some best practices to ensure your visualizations are effective and user-friendly:
- Provide clear labels: Always include a descriptive label for your Textbox Widget to indicate what type of input is expected.
-
Use appropriate input validation: Implement input validation to handle unexpected user input gracefully.
-
Position widgets thoughtfully: Place Textbox Widgets in locations that don’t obscure important parts of your plot.
-
Provide feedback: Use visual cues or text updates to confirm that user input has been processed.
-
Combine with other widgets: Consider using Textbox Widgets in conjunction with other widget types for more complex interactions.
Let’s implement these best practices in an example:
import matplotlib.pyplot as plt
from matplotlib.widgets import TextBox, Button
import numpy as np
fig, ax = plt.subplots(figsize=(10, 6))
ax.set_title("Best Practices for Matplotlib Textbox Widgets - how2matplotlib.com")
x = np.linspace(0, 10, 100)
line, = ax.plot(x, np.sin(x))
feedback_text = ax.text(0.5, -0.15, "", ha='center', transform=ax.transAxes)
freq_textbox = TextBox(ax.inset_axes([0.1, 0.05, 0.3, 0.075]), "Frequency (0-10):",
initial="1")
amp_textbox = TextBox(ax.inset_axes([0.5, 0.05, 0.3, 0.075]), "Amplitude (0-2):",
initial="1")
reset_button = Button(ax.inset_axes([0.85, 0.05, 0.1, 0.075]), "Reset")
def update(val):
try:
freq = float(freq_textbox.text)
amp = float(amp_textbox.text)
if 0 <= freq <= 10 and 0 <= amp <= 2:
line.set_ydata(amp * np.sin(freq * x))
feedback_text.set_text(f"Updated: Frequency = {freq}, Amplitude = {amp}")
else:
feedback_text.set_text("Error: Values out of range")
except ValueError:
feedback_text.set_text("Error: Invalid input")
plt.draw()
def reset(event):
freq_textbox.set_val("1")
amp_textbox.set_val("1")
line.set_ydata(np.sin(x))
feedback_text.set_text("Reset to default values")
plt.draw()
freq_textbox.on_submit(update)
amp_textbox.on_submit(update)
reset_button.on_clicked(reset)
plt.tight_layout()
plt.show()
Output:
This example incorporates all the best practices mentioned above, creating a user-friendly interface for adjusting a sine wave’s properties.
Common Challenges and Solutions with Matplotlib Textbox Widgets
While working with Matplotlib Textbox Widgets, you may encounter some common challenges. Let’s address these issues and provide solutions:
Challenge 1: Handling Invalid Input
One common issue is dealing with invalid user input. Here’s how you can handle this gracefully:
import matplotlib.pyplot as plt
from matplotlib.widgets import TextBox
import numpy as np
fig, ax = plt.subplots()
ax.set_title("Handling Invalid Input - how2matplotlib.com")
x = np.linspace(0, 10, 100)
line, = ax.plot(x, np.sin(x))
feedback_text = ax.text(0.5, -0.15, "", ha='center', transform=ax.transAxes)
textbox = TextBox(ax.inset_axes([0.1, 0.05, 0.8, 0.075]), "Frequency:",
initial="1")
def update(text):
try:
freq = float(text)
if freq > 0:
line.set_ydata(np.sin(freq * x))
feedback_text.set_text(f"Frequency: {freq}")
else:
feedback_text.set_text("Error: Frequency must be positive")
except ValueError:
feedback_text.set_text("Error: Invalid input")
plt.draw()
textbox.on_submit(update)
plt.show()
Output:
This example demonstrates how to handle invalid input by providing clear feedback to the user.
Challenge 2: Updating Multiple Plot Elements
Sometimes you need to update multiple elements of your plot based on user input. Here’s how to manage this:
import matplotlib.pyplot as plt
from matplotlib.widgets import TextBox
import numpy as np
fig, (ax1, ax2) = plt.subplots(2, 1, figsize=(8, 8))
fig.suptitle("Updating Multiple Plot Elements - how2matplotlib.com")
x = np.linspace(0, 10, 100)
line1, = ax1.plot(x, np.sin(x))
line2, = ax2.plot(x, np.cos(x))
textbox = TextBox(fig.add_axes([0.1, 0.05, 0.8, 0.03]), "Frequency:",
initial="1")
def update(text):
try:
freq = float(text)
line1.set_ydata(np.sin(freq * x))
line2.set_ydata(np.cos(freq * x))
ax1.set_title(f"Sin wave (Freq: {freq})")
ax2.set_title(f"Cos wave (Freq: {freq})")
plt.draw()
except ValueError:
pass
textbox.on_submit(update)
plt.tight_layout()
plt.show()
Output:
This example shows how to update multiple plot elements (two different lines and their titles) based on a single Textbox Widget input.
Challenge 3: Maintaining Plot Limits
When updating plots based on user input, it’s important to maintain appropriate axis limits:
import matplotlib.pyplot as plt
from matplotlib.widgets import TextBox
import numpy as np
fig, ax = plt.subplots()
ax.set_title("Maintaining Plot Limits - how2matplotlib.com")
x = np.linspace(0, 10, 100)
line, = ax.plot(x, np.sin(x))
ax.set_ylim(-2, 2)
textbox = TextBox(ax.inset_axes([0.1, 0.05, 0.8, 0.075]), "Amplitude:",
initial="1")
def update(text):
try:
amp = float(text)
y = amp * np.sin(x)
line.set_ydata(y)
ax.set_ylim(min(-2, y.min()), max(2, y.max()))
plt.draw()
except ValueError:
pass
textbox.on_submit(update)
plt.show()
Output:
This example demonstrates how to dynamically adjust the y-axis limits based on user input while maintaining a minimum range.
Advanced Applications of Matplotlib Textbox Widgets
Matplotlib Textbox Widgets can be used in various advanced applications. Let’s explore some of these scenarios:
Data Filtering
You can use Textbox Widgets to implement real-time data filtering:
import matplotlib.pyplot as plt
from matplotlib.widgets import TextBox
import numpy as np
fig, ax = plt.subplots()
ax.set_title("Data Filtering with Matplotlib Textbox Widget - how2matplotlib.com")
np.random.seed(42)
data = np.random.randn(1000)
n, bins, patches = ax.hist(data, 50, density=True)
textbox = TextBox(ax.inset_axes([0.1, 0.05, 0.8, 0.075]), "Filter (min, max):",
initial="-inf, inf")
def update(text):
try:
min_val, max_val = map(float, text.split(','))
filtered_data = data[(data >= min_val) & (data <= max_val)]
ax.clear()
ax.set_title("Data Filtering with Matplotlib Textbox Widget - how2matplotlib.com")
ax.hist(filtered_data, 50, density=True)
plt.draw()
except ValueError:
pass
textbox.on_submit(update)
plt.show()
Output:
This example allows users to filter a histogram by specifying minimum and maximum values through a Textbox Widget.
Custom Function Plotting
You can use Textbox Widgets to plot custom functions entered by the user:
import matplotlib.pyplot as plt
from matplotlib.widgets import TextBox
import numpy as np
fig, ax = plt.subplots()
ax.set_title("Custom Function Plotting - how2matplotlib.com")
x = np.linspace(-10, 10, 1000)
line, = ax.plot(x, np.sin(x))
ax.set_ylim(-10, 10)
textbox = TextBox(ax.inset_axes([0.1, 0.05, 0.8, 0.075]), "Function:",
initial="sin(x)")
def update(text):
try:
y = eval(f"lambda x: {text}")(x)
line.set_ydata(y)
ax.set_ylim(min(-10, y.min()), max(10, y.max()))
plt.draw()
except:
pass
textbox.on_submit(update)
plt.show()
Output:
This example allows users to enter custom mathematical functions that are then plotted in real-time.
Interactive Data Analysis
Textbox Widgets can be used for interactive data analysis tasks:
import matplotlib.pyplot as plt
from matplotlib.widgets import TextBox
import numpy as np
from scipy import stats
fig, ax = plt.subplots()
ax.set_title("Interactive Data Analysis - how2matplotlib.com")
np.random.seed(42)
x = np.random.randn(100)
y = 2*x + 1 + np.random.randn(100)*0.5
ax.scatter(x, y)
line, = ax.plot([], [], 'r-')
textbox = TextBox(ax.inset_axes([0.1, 0.05, 0.8, 0.075]), "Percentile:",
initial="50")
def update(text):
try:
percentile = float(text)
if 0 <= percentile <= 100:
mask = x <= np.percentile(x, percentile)
slope, intercept, r_value, _, _ = stats.linregress(x[mask], y[mask])
x_line = np.linspace(x.min(), x.max(), 100)
y_line = slope * x_line + intercept
line.set_data(x_line, y_line)
ax.set_title(f"Linear Regression (R² = {r_value**2:.2f}) - how2matplotlib.com")
plt.draw()
except ValueError:
pass
textbox.on_submit(update)
plt.show()
Output:
This example demonstrates how to use a Textbox Widget for interactive linear regression analysis based on data percentiles.
Optimizing Performance with Matplotlib Textbox Widgets
When working with large datasets or complex visualizations, it’s important to optimize the performance of your Matplotlib Textbox Widgets. Here are some techniques to improve responsiveness:
Debouncing User Input
For frequent updates, you can implement a debounce function to limit the number of plot updates:
import matplotlib.pyplot as plt
from matplotlib.widgets import TextBox
import numpy as np
from functools import partial
from threading import Timer
fig, ax = plt.subplots()
ax.set_title("Debounced Matplotlib Textbox Widget - how2matplotlib.com")
x = np.linspace(0, 10, 1000)
line, = ax.plot(x, np.sin(x))
textbox = TextBox(ax.inset_axes([0.1, 0.05, 0.8, 0.075]), "Frequency:",
initial="1")
def debounce(wait):
def decorator(fn):
def debounced(*args, **kwargs):
def call_it():
fn(*args, **kwargs)
try:
debounced.t.cancel()
except(AttributeError):
pass
debounced.t = Timer(wait, call_it)
debounced.t.start()
return debounced
return decorator
@debounce(0.3)
def update(text):
try:
freq = float(text)
line.set_ydata(np.sin(freq * x))
plt.draw()
except ValueError:
pass
textbox.on_text_change(update)
plt.show()
Output:
This example uses a debounce decorator to limit the frequency of plot updates, improving performance for rapid user input.
Using Blitting for Faster Updates
For even faster updates, you can use blitting to redraw only the parts of the plot that have changed:
import matplotlib.pyplot as plt
from matplotlib.widgets import TextBox
import numpy as np
fig, ax = plt.subplots()
ax.set_title("Fast Updates with Blitting - how2matplotlib.com")
x = np.linspace(0, 10, 1000)
line, = ax.plot(x, np.sin(x))
textbox = TextBox(ax.inset_axes([0.1, 0.05, 0.8, 0.075]), "Frequency:",
initial="1")
# Store the background
background = fig.canvas.copy_from_bbox(ax.bbox)
def update(text):
try:
freq = float(text)
y = np.sin(freq * x)
line.set_ydata(y)
# Restore the background
fig.canvas.restore_region(background)
# Redraw just the line
ax.draw_artist(line)
# Blit the updated axes
fig.canvas.blit(ax.bbox)
except ValueError:
pass
textbox.on_submit(update)
plt.show()
Output:
This example uses blitting to achieve faster updates by redrawing only the parts of the plot that have changed.
Integrating Matplotlib Textbox Widgets with Other Libraries
Matplotlib Textbox Widgets can be integrated with other popular Python libraries for more advanced visualizations and data analysis:
Integration with Pandas
You can use Matplotlib Textbox Widgets to interactively explore Pandas DataFrames:
import matplotlib.pyplot as plt
from matplotlib.widgets import TextBox
import pandas as pd
import numpy as np
# Create a sample DataFrame
np.random.seed(42)
df = pd.DataFrame({
'A': np.random.randn(1000),
'B': np.random.randn(1000),
'C': np.random.randn(1000)
})
fig, ax = plt.subplots()
ax.set_title("Pandas Integration - how2matplotlib.com")
scatter = ax.scatter(df['A'], df['B'], c=df['C'], cmap='viridis')
plt.colorbar(scatter)
textbox = TextBox(ax.inset_axes([0.1, 0.05, 0.8, 0.075]), "Query:",
initial="A > 0 and B > 0")
def update(query):
try:
mask = df.eval(query)
scatter.set_offsets(df[mask][['A', 'B']])
scatter.set_array(df[mask]['C'])
ax.set_xlim(df['A'].min(), df['A'].max())
ax.set_ylim(df['B'].min(), df['B'].max())
plt.draw()
except:
pass
textbox.on_submit(update)
plt.show()
Output:
This example demonstrates how to use a Textbox Widget to filter and visualize data from a Pandas DataFrame.
Integration with Scikit-learn
You can combine Matplotlib Textbox Widgets with machine learning libraries like Scikit-learn:
import matplotlib.pyplot as plt
from matplotlib.widgets import TextBox
from sklearn.datasets import make_classification
from sklearn.svm import SVC
import numpy as np
# Generate a sample dataset
X, y = make_classification(n_samples=100, n_features=2, n_informative=2,
n_redundant=0, n_clusters_per_class=1, random_state=42)
fig, ax = plt.subplots()
ax.set_title("SVM Classification - how2matplotlib.com")
scatter = ax.scatter(X[:, 0], X[:, 1], c=y, cmap='viridis')
textbox = TextBox(ax.inset_axes([0.1, 0.05, 0.8, 0.075]), "C parameter:",
initial="1.0")
def update(text):
try:
C = float(text)
clf = SVC(C=C, kernel='linear')
clf.fit(X, y)
# Create a mesh to plot in
x_min, x_max = X[:, 0].min() - 1, X[:, 0].max() + 1
y_min, y_max = X[:, 1].min() - 1, X[:, 1].max() + 1
xx, yy = np.meshgrid(np.arange(x_min, x_max, 0.02),
np.arange(y_min, y_max, 0.02))
Z = clf.predict(np.c_[xx.ravel(), yy.ravel()])
Z = Z.reshape(xx.shape)
ax.clear()
ax.contourf(xx, yy, Z, alpha=0.8, cmap='viridis')
ax.scatter(X[:, 0], X[:, 1], c=y, cmap='viridis', edgecolor='black')
ax.set_title(f"SVM Classification (C={C}) - how2matplotlib.com")
plt.draw()
except ValueError:
pass
textbox.on_submit(update)
plt.show()
Output:
This example shows how to use a Textbox Widget to adjust the C parameter of an SVM classifier and visualize the decision boundary in real-time.
Conclusion
Matplotlib Textbox Widgets are powerful tools for creating interactive and dynamic visualizations. Throughout this comprehensive guide, we’ve explored various aspects of these widgets, from basic implementation to advanced techniques and integrations with other libraries.
We’ve covered topics such as:
- Understanding and implementing basic Matplotlib Textbox Widgets
- Customizing the appearance and behavior of Textbox Widgets
- Handling user input and updating plots in real-time
- Combining Textbox Widgets with other Matplotlib widgets
- Best practices for using Textbox Widgets effectively
- Addressing common challenges and optimizing performance
- Advanced applications in data filtering, custom function plotting, and interactive data analysis
- Integrating Textbox Widgets with popular libraries like Pandas and Scikit-learn
By mastering Matplotlib Textbox Widgets, you can create more engaging and interactive data visualizations that allow users to explore and analyze data in real-time. Whether you’re working on simple plots or complex data analysis projects, Textbox Widgets provide a flexible and powerful tool for enhancing your visualizations.