How to Use Matplotlib Lasso Selector Widget for Interactive Data Selection
Matplotlib Lasso Selector Widget is a powerful tool for interactive data selection in data visualization. This article will explore the various aspects of the Matplotlib Lasso Selector Widget, its implementation, and practical applications. We’ll dive deep into how this widget can enhance your data analysis and visualization workflows.
Introduction to Matplotlib Lasso Selector Widget
The Matplotlib Lasso Selector Widget is an interactive tool that allows users to select data points on a plot by drawing a freeform lasso around them. This widget is particularly useful when working with scatter plots or other visualizations where you need to select specific data points for further analysis or highlighting.
Let’s start with a basic example of how to implement a Matplotlib Lasso Selector Widget:
import numpy as np
import matplotlib.pyplot as plt
from matplotlib.widgets import LassoSelector
from matplotlib.path import Path

class SelectFromCollection:
    def __init__(self, ax, collection, alpha_other=0.3):
        self.canvas = ax.figure.canvas
        self.collection = collection
        self.alpha_other = alpha_other

        self.xys = collection.get_offsets()
        self.Npts = len(self.xys)

        self.fc = collection.get_facecolors()
        self.fc[:, -1] = np.ones(self.Npts)
        self.lasso = LassoSelector(ax, onselect=self.onselect)

    def onselect(self, verts):
        path = Path(verts)
        self.ind = np.nonzero(path.contains_points(self.xys))[0]
        self.fc[:, -1] = self.alpha_other
        self.fc[self.ind, -1] = 1
        self.collection.set_facecolors(self.fc)
        self.canvas.draw_idle()

    def disconnect(self):
        self.lasso.disconnect_events()
        self.fc[:, -1] = 1
        self.collection.set_facecolors(self.fc)
        self.canvas.draw_idle()

fig, ax = plt.subplots()
pts = ax.scatter(np.random.rand(100), np.random.rand(100), s=80)
selector = SelectFromCollection(ax, pts)

plt.title("Matplotlib Lasso Selector Widget - how2matplotlib.com")
plt.show()
In this example, we create a scatter plot with random points and implement the Lasso Selector Widget. Users can draw a lasso around points to select them, and the selected points will remain highlighted while others become transparent.
Understanding the Matplotlib Lasso Selector Widget
The Matplotlib Lasso Selector Widget is part of the matplotlib.widgets module. It allows users to select data points by drawing a freeform lasso around them on a matplotlib plot. This widget is particularly useful for interactive data exploration and analysis.
Let’s break down the key components of the Lasso Selector Widget:
- LassoSelector: This is the main class that implements the lasso selection functionality.
- onselect: This is a callback function that is triggered when a selection is made.
- Path: This class from
matplotlib.pathis used to create a path from the lasso vertices and check which points are inside the selection.
Here’s a simple example that demonstrates these components:
import numpy as np
import matplotlib.pyplot as plt
from matplotlib.widgets import LassoSelector
from matplotlib.path import Path

def onselect(verts):
    path = Path(verts)
    ind = path.contains_points(points)
    selected.set_visible(True)
    selected.set_data(points[ind].T)
    fig.canvas.draw_idle()

fig, ax = plt.subplots()
points = np.random.rand(100, 2)
scatter = ax.scatter(points[:, 0], points[:, 1])
selected, = ax.plot([], [], 'ro', markersize=10, visible=False)

lasso = LassoSelector(ax, onselect)

plt.title("Simple Lasso Selector - how2matplotlib.com")
plt.show()
Output:
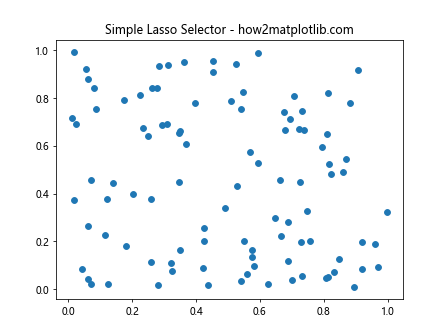
In this example, we create a scatter plot and implement a basic Lasso Selector. When the user draws a lasso, the selected points are highlighted in red.
Customizing the Matplotlib Lasso Selector Widget
The Matplotlib Lasso Selector Widget can be customized to suit various needs. You can modify its appearance, behavior, and interaction with other plot elements. Let’s explore some customization options:
Changing the Lasso Color and Style
You can change the color and style of the lasso line by passing additional parameters to the LassoSelector:
import numpy as np
import matplotlib.pyplot as plt
from matplotlib.widgets import LassoSelector

def onselect(verts):
    pass  # Implement your selection logic here

fig, ax = plt.subplots()
x = np.random.rand(100)
y = np.random.rand(100)
scatter = ax.scatter(x, y)

lasso = LassoSelector(
    ax, onselect,
    lineprops={'color': 'red', 'linewidth': 2, 'linestyle': '--'}
)

plt.title("Customized Lasso Selector - how2matplotlib.com")
plt.show()
In this example, we’ve customized the lasso to be a red dashed line with a width of 2.
Adding a Selection Callback
You can define a callback function that is triggered when a selection is made. This allows you to perform specific actions based on the selected data:
import numpy as np
import matplotlib.pyplot as plt
from matplotlib.widgets import LassoSelector

class SelectionHandler:
    def __init__(self, ax, collection):
        self.ax = ax
        self.collection = collection
        self.xys = collection.get_offsets()
        self.lasso = LassoSelector(ax, onselect=self.onselect)

    def onselect(self, verts):
        path = Path(verts)
        selected = path.contains_points(self.xys)
        self.collection.set_array(selected.astype(float))
        self.ax.figure.canvas.draw_idle()

fig, ax = plt.subplots()
x = np.random.rand(100)
y = np.random.rand(100)
scatter = ax.scatter(x, y, c='blue')

handler = SelectionHandler(ax, scatter)

plt.title("Lasso Selector with Callback - how2matplotlib.com")
plt.show()
Output:
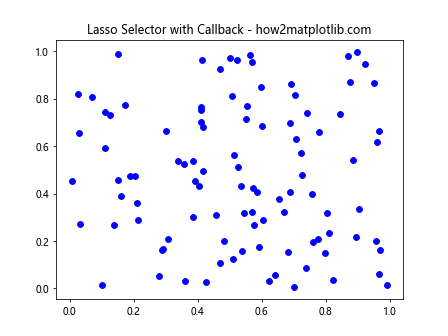
In this example, the selected points change color when the lasso selection is made.
Advanced Techniques with Matplotlib Lasso Selector Widget
Now that we’ve covered the basics, let’s explore some advanced techniques using the Matplotlib Lasso Selector Widget.
Multiple Lasso Selectors
You can implement multiple Lasso Selectors on different subplots to compare selections across different datasets:
import numpy as np
import matplotlib.pyplot as plt
from matplotlib.widgets import LassoSelector
from matplotlib.path import Path

class MultiLassoSelector:
    def __init__(self, axes, collections):
        self.axes = axes
        self.collections = collections
        self.selectors = [LassoSelector(ax, onselect=self.onselect(i))
                          for i, ax in enumerate(axes)]

    def onselect(self, index):
        def _onselect(verts):
            path = Path(verts)
            collection = self.collections[index]
            xys = collection.get_offsets()
            selected = path.contains_points(xys)
            collection.set_array(selected.astype(float))
            self.axes[index].figure.canvas.draw_idle()
        return _onselect

fig, (ax1, ax2) = plt.subplots(1, 2, figsize=(12, 6))

x1 = np.random.rand(100)
y1 = np.random.rand(100)
scatter1 = ax1.scatter(x1, y1, c='blue')

x2 = np.random.rand(100)
y2 = np.random.rand(100)
scatter2 = ax2.scatter(x2, y2, c='green')

multi_selector = MultiLassoSelector([ax1, ax2], [scatter1, scatter2])

ax1.set_title("Dataset 1 - how2matplotlib.com")
ax2.set_title("Dataset 2 - how2matplotlib.com")
plt.show()
Output:
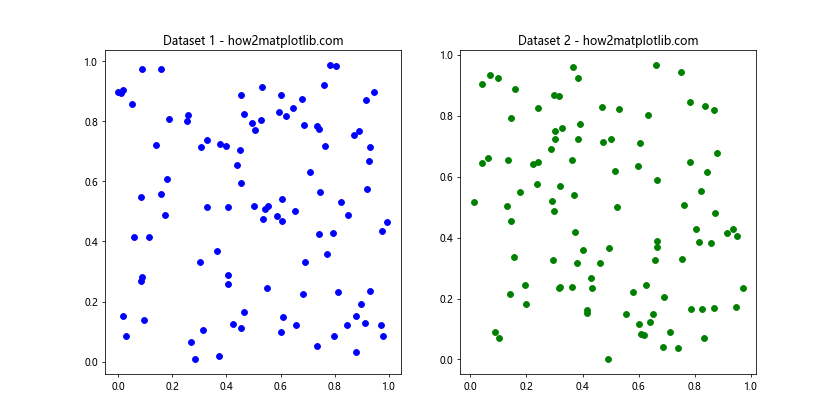
This example creates two scatter plots with separate Lasso Selectors, allowing for independent selections on each plot.
Combining Lasso Selector with Other Widgets
You can combine the Lasso Selector with other Matplotlib widgets for more complex interactions. Here’s an example that combines a Lasso Selector with a Button widget to clear the selection:
import numpy as np
import matplotlib.pyplot as plt
from matplotlib.widgets import LassoSelector, Button
from matplotlib.path import Path

class LassoSelectorWithClear:
    def __init__(self, ax, collection):
        self.ax = ax
        self.collection = collection
        self.xys = collection.get_offsets()
        self.lasso = LassoSelector(ax, onselect=self.onselect)
        self.selected = np.zeros(len(self.xys), dtype=bool)

    def onselect(self, verts):
        path = Path(verts)
        self.selected = path.contains_points(self.xys)
        self.collection.set_array(self.selected.astype(float))
        self.ax.figure.canvas.draw_idle()

    def clear_selection(self, event):
        self.selected[:] = False
        self.collection.set_array(self.selected.astype(float))
        self.ax.figure.canvas.draw_idle()

fig, ax = plt.subplots()
x = np.random.rand(100)
y = np.random.rand(100)
scatter = ax.scatter(x, y, c='blue')

selector = LassoSelectorWithClear(ax, scatter)

ax_clear = plt.axes([0.8, 0.025, 0.1, 0.04])
button_clear = Button(ax_clear, 'Clear')
button_clear.on_clicked(selector.clear_selection)

plt.title("Lasso Selector with Clear Button - how2matplotlib.com")
plt.show()
Output:
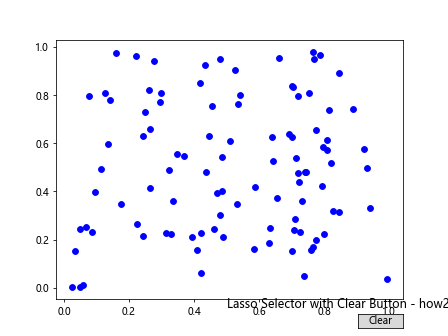
This example adds a “Clear” button that resets the selection when clicked.
Practical Applications of Matplotlib Lasso Selector Widget
The Matplotlib Lasso Selector Widget has numerous practical applications in data analysis and visualization. Let’s explore some real-world scenarios where this widget can be particularly useful.
Outlier Detection
The Lasso Selector can be used to interactively identify and analyze outliers in a dataset:
import numpy as np
import matplotlib.pyplot as plt
from matplotlib.widgets import LassoSelector
from matplotlib.path import Path

class OutlierDetector:
    def __init__(self, ax, collection):
        self.ax = ax
        self.collection = collection
        self.xys = collection.get_offsets()
        self.lasso = LassoSelector(ax, onselect=self.onselect)

    def onselect(self, verts):
        path = Path(verts)
        selected = path.contains_points(self.xys)
        colors = np.where(selected, 'red', 'blue')
        self.collection.set_facecolors(colors)
        self.ax.figure.canvas.draw_idle()

        outliers = self.xys[selected]
        print(f"Selected {len(outliers)} potential outliers")
        print("Outlier coordinates:")
        print(outliers)

fig, ax = plt.subplots()
x = np.random.normal(0, 1, 1000)
y = np.random.normal(0, 1, 1000)
x[::100] += np.random.normal(0, 5, 10)  # Add some outliers
y[::100] += np.random.normal(0, 5, 10)  # Add some outliers
scatter = ax.scatter(x, y, c='blue')

outlier_detector = OutlierDetector(ax, scatter)

plt.title("Outlier Detection with Lasso Selector - how2matplotlib.com")
plt.show()
Output:
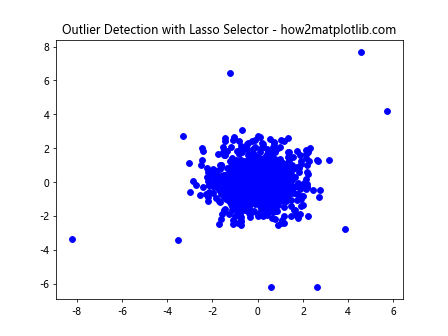
In this example, users can draw a lasso around suspected outliers, which are then highlighted in red and their coordinates are printed.
Cluster Analysis
The Lasso Selector can assist in interactive cluster analysis by allowing users to select and analyze specific clusters:
import numpy as np
import matplotlib.pyplot as plt
from matplotlib.widgets import LassoSelector
from matplotlib.path import Path
from sklearn.cluster import KMeans

class ClusterAnalyzer:
    def __init__(self, ax, collection, n_clusters=3):
        self.ax = ax
        self.collection = collection
        self.xys = collection.get_offsets()
        self.lasso = LassoSelector(ax, onselect=self.onselect)

        # Perform initial clustering
        self.kmeans = KMeans(n_clusters=n_clusters)
        self.labels = self.kmeans.fit_predict(self.xys)
        self.collection.set_array(self.labels)

    def onselect(self, verts):
        path = Path(verts)
        selected = path.contains_points(self.xys)
        selected_cluster = self.labels[selected]
        unique, counts = np.unique(selected_cluster, return_counts=True)

        print("Selected cluster composition:")
        for cluster, count in zip(unique, counts):
            print(f"Cluster {cluster}: {count} points")

fig, ax = plt.subplots()
x = np.concatenate([np.random.normal(0, 1, 300),
                    np.random.normal(5, 1, 300),
                    np.random.normal(10, 1, 300)])
y = np.concatenate([np.random.normal(0, 1, 300),
                    np.random.normal(5, 1, 300),
                    np.random.normal(0, 1, 300)])
scatter = ax.scatter(x, y, c='blue', cmap='viridis')

cluster_analyzer = ClusterAnalyzer(ax, scatter)

plt.title("Cluster Analysis with Lasso Selector - how2matplotlib.com")
plt.colorbar(scatter)
plt.show()
Output:
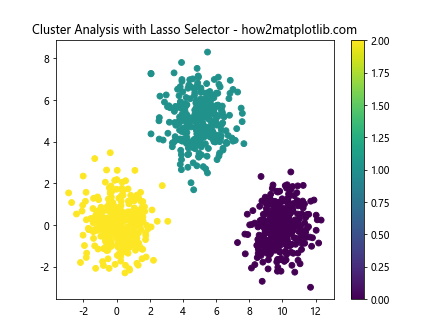
This example performs initial clustering using K-means and allows users to select regions to analyze the cluster composition.
Time Series Data Selection
The Lasso Selector can be useful for selecting specific time periods in time series data:
import numpy as np
import matplotlib.pyplot as plt
from matplotlib.widgets import LassoSelector
from matplotlib.path import Path
import pandas as pd

class TimeSeriesSelector:
    def __init__(self, ax, line):
        self.ax = ax
        self.line = line
        self.xys = line.get_xydata()
        self.lasso = LassoSelector(ax, onselect=self.onselect)

    def onselect(self, verts):
        path = Path(verts)
        selected = path.contains_points(self.xys)
        selected_data = self.xys[selected]

        if len(selected_data) > 0:
            start_date = pd.to_datetime(selected_data[0, 0], unit='D')
            end_date = pd.to_datetime(selected_data[-1, 0], unit='D')
            print(f"Selected time range: {start_date} to {end_date}")
            print(f"Average value in selection: {np.mean(selected_data[:, 1]):.2f}")

# Generate sample time series data
dates = pd.date_range(start='2023-01-01', end='2023-12-31', freq='D')
values = np.cumsum(np.random.randn(len(dates))) + 100

fig, ax = plt.subplots(figsize=(12, 6))
line, = ax.plot(dates.to_matplotlib(), values)

time_selector = TimeSeriesSelector(ax, line)

plt.title("Time Series Selection with Lasso - how2matplotlib.com")
plt.xlabel("Date")
plt.ylabel("Value")
plt.show()
This example allows users to select specific time periods in a time series plot and provides information about the selected range.
Advanced Features of Matplotlib Lasso Selector Widget
Let’s explore some more advanced features and use cases of the Matplotlib Lasso Selector Widget.
Multiple Data Series Selection
You can use the Lasso Selector to select data points from multiple data series simultaneously:
import numpy as np
import matplotlib.pyplot as plt
from matplotlib.widgets import LassoSelector
from matplotlib.path import Path

class MultiSeriesSelector:
    def __init__(self, ax, collections):
        self.ax = ax
        self.collections = collections
        self.xys = [c.get_offsets() for c in collections]
        self.lasso = LassoSelector(ax, onselect=self.onselect)

    def onselect(self, verts):
        path = Path(verts)
        for i, (collection, xy) in enumerate(zip(self.collections, self.xys)):
            selected = path.contains_points(xy)
            collection.set_array(selected.astype(float))
            print(f"Series {i+1}: Selected {np.sum(selected)} points")
        self.ax.figure.canvas.draw_idle()

fig, ax = plt.subplots()

# Generate three data series
x1, y1 = np.random.rand(2, 100)
x2, y2 = np.random.rand(2, 100) + 1
x3, y3 = np.random.rand(2, 100) + 2

scatter1 = ax.scatter(x1, y1, c='blue', label='Series 1')
scatter2 = ax.scatter(x2, y2, c='red', label='Series 2')
scatter3 = ax.scatter(x3, y3, c='green', label='Series 3')

multi_selector = MultiSeriesSelector(ax, [scatter1, scatter2, scatter3])

plt.title("Multi-Series Selection with Lasso - how2matplotlib.com")
plt.legend()
plt.show()
Output:
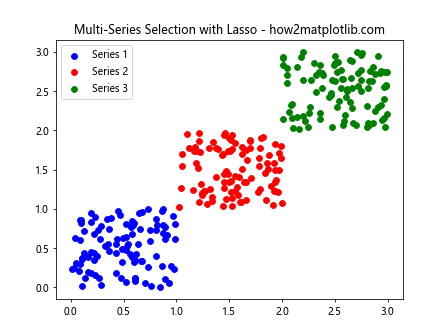
This example allows users to select points from three different data series using a single lasso.
Lasso Selection with Zoom and Pan
Combining the Lasso Selector with zoom and pan functionality can enhance the user’s ability to select data points precisely:
import numpy as np
import matplotlib.pyplot as plt
from matplotlib.widgets import LassoSelector
from matplotlib.path import Path

class ZoomPanLassoSelector:
    def __init__(self, ax, collection):
        self.ax = ax
        self.collection = collection
        self.xys = collection.get_offsets()
        self.lasso = LassoSelector(ax, onselect=self.onselect)

        # Enable zoom and pan
        self.ax.figure.canvas.mpl_connect('key_press_event', self.on_key_press)
        self.pan_zoom_mode = False

    def onselect(self, verts):
        if not self.pan_zoom_mode:
            path = Path(verts)
            selected = path.contains_points(self.xys)
            self.collection.set_array(selected.astype(float))
            self.ax.figure.canvas.draw_idle()

    def on_key_press(self, event):
        if event.key == 'z':
            self.pan_zoom_mode = not self.pan_zoom_mode
            if self.pan_zoom_mode:
                self.ax.set_navigate(True)
                print("Zoom and pan mode enabled")
            else:
                self.ax.set_navigate(False)
                print("Lasso selection mode enabled")

fig, ax = plt.subplots()
x = np.random.rand(1000)
y = np.random.rand(1000)
scatter = ax.scatter(x, y, c='blue')

selector = ZoomPanLassoSelector(ax, scatter)

plt.title("Lasso Selection with Zoom and Pan - how2matplotlib.com")
plt.text(0.5, -0.1, "Press 'z' to toggle between lasso and zoom/pan modes",
         ha='center', va='center', transform=ax.transAxes)
plt.show()
Output:
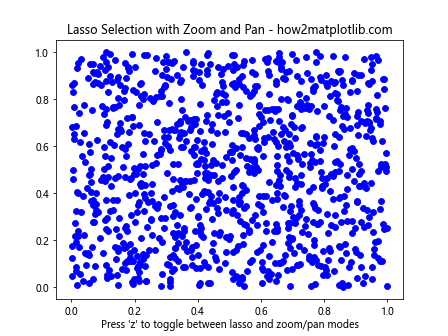
In this example, users can toggle between lasso selection mode and zoom/pan mode by pressing the ‘z’ key.
Integrating Matplotlib Lasso Selector Widget with Data Analysis
The Lasso Selector Widget can be integrated with various data analysis techniques to create powerful interactive visualization tools. Let’s explore some examples.
K-Means Clustering with Lasso Selection
Combine K-means clustering with Lasso selection to interactively explore cluster assignments:
import numpy as np
import matplotlib.pyplot as plt
from matplotlib.widgets import LassoSelector, Button
from matplotlib.path import Path
from sklearn.cluster import KMeans

class InteractiveKMeans:
    def __init__(self, ax, data, n_clusters=3):
        self.ax = ax
        self.data = data
        self.n_clusters = n_clusters
        self.scatter = ax.scatter(data[:, 0], data[:, 1], c='gray')
        self.lasso = LassoSelector(ax, onselect=self.onselect)
        self.kmeans = KMeans(n_clusters=n_clusters)
        self.cluster_colors = ['red', 'green', 'blue', 'yellow', 'purple']

    def onselect(self, verts):
        path = Path(verts)
        selected = path.contains_points(self.data)
        selected_data = self.data[selected]

        if len(selected_data) > 0:
            labels = self.kmeans.fit_predict(selected_data)
            colors = [self.cluster_colors[label % len(self.cluster_colors)] for label in labels]
            self.ax.scatter(selected_data[:, 0], selected_data[:, 1], c=colors)
            self.ax.figure.canvas.draw_idle()

    def reset(self, event):
        self.scatter.set_color('gray')
        self.ax.figure.canvas.draw_idle()

# Generate sample data
np.random.seed(0)
data = np.concatenate([
    np.random.normal(0, 1, (300, 2)),
    np.random.normal(4, 1.5, (300, 2)),
    np.random.normal(-4, 2, (300, 2))
])

fig, ax = plt.subplots(figsize=(10, 8))
kmeans_selector = InteractiveKMeans(ax, data)

ax_reset = plt.axes([0.8, 0.025, 0.1, 0.04])
button_reset = Button(ax_reset, 'Reset')
button_reset.on_clicked(kmeans_selector.reset)

plt.title("Interactive K-Means with Lasso Selection - how2matplotlib.com")
plt.show()
Output:
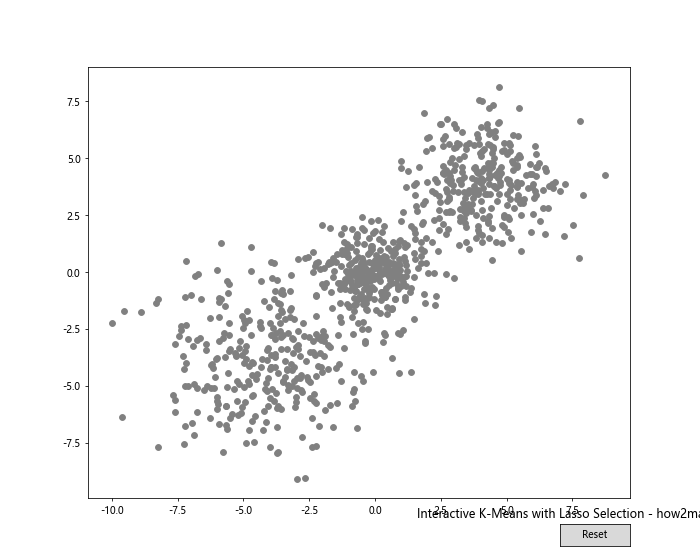
This example allows users to select a region of points, which are then clustered using K-means. The clusters are visualized with different colors.
Correlation Analysis with Lasso Selection
Use the Lasso Selector to analyze correlations between selected data points:
import numpy as np
import matplotlib.pyplot as plt
from matplotlib.widgets import LassoSelector
from matplotlib.path import Path
import pandas as pd

class CorrelationAnalyzer:
    def __init__(self, ax, data):
        self.ax = ax
        self.data = data
        self.scatter = ax.scatter(data[:, 0], data[:, 1], c='blue')
        self.lasso = LassoSelector(ax, onselect=self.onselect)

    def onselect(self, verts):
        path = Path(verts)
        selected = path.contains_points(self.data)
        selected_data = self.data[selected]

        if len(selected_data) > 2:
            df = pd.DataFrame(selected_data, columns=['X', 'Y'])
            correlation = df.corr().iloc[0, 1]
            print(f"Correlation of selected points: {correlation:.2f}")

            # Highlight selected points
            self.scatter.set_color(['red' if s else 'blue' for s in selected])
            self.ax.figure.canvas.draw_idle()

# Generate correlated data
np.random.seed(0)
x = np.random.randn(1000)
y = 2 * x + np.random.randn(1000) * 0.5
data = np.column_stack((x, y))

fig, ax = plt.subplots(figsize=(10, 8))
correlation_analyzer = CorrelationAnalyzer(ax, data)

plt.title("Correlation Analysis with Lasso Selection - how2matplotlib.com")
plt.xlabel("X")
plt.ylabel("Y")
plt.show()
Output:
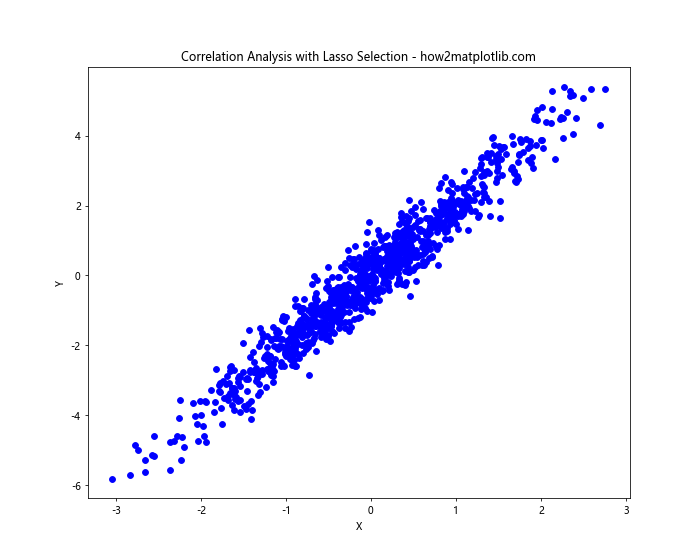
This example allows users to select a subset of points and calculates the correlation between the X and Y variables for the selected data.
Best Practices for Using Matplotlib Lasso Selector Widget
When working with the Matplotlib Lasso Selector Widget, consider the following best practices to enhance your visualizations and user experience:
- Clear Instructions: Provide clear instructions to users on how to use the Lasso Selector, especially if it’s part of a larger application.
Responsive Feedback: Ensure that the visualization provides immediate feedback when a selection is made. This could be through color changes, highlighting, or displaying statistics about the selection.
Combine with Other Widgets: Consider combining the Lasso Selector with other widgets like buttons or sliders to provide additional functionality.
Handle Edge Cases: Implement proper handling for edge cases, such as when no points are selected or when all points are selected.
Performance Optimization: For large datasets, consider optimizing your code to handle selections efficiently. This might involve using techniques like data downsampling or more efficient data structures.
Consistent Styling: Maintain a consistent visual style between the Lasso Selector and the rest of your visualization to create a cohesive user interface.
Here’s an example that incorporates some of these best practices: