Matplotlib Basic Units
Matplotlib is a comprehensive library for creating static, animated, and interactive visualizations in Python. It provides an object-oriented API for embedding plots into applications using general-purpose GUI toolkits like Tkinter, wxPython, Qt, or GTK. For scientists, engineers, and data analysts, mastering Matplotlib is an essential skill. This article aims to cover the basic units of Matplotlib, providing a solid foundation for those new to the library or looking to deepen their understanding. Through a series of examples, we’ll explore the core components of Matplotlib, including figures, axes, lines, markers, and more.
Getting Started with Matplotlib
Before diving into the examples, ensure you have Matplotlib installed. If not, you can install it using pip:
pip install matplotlib
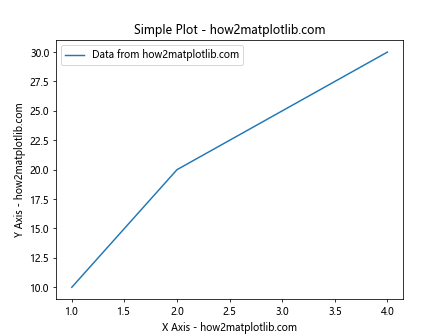
Example 1: Creating a Simple Plot
This example demonstrates how to create a simple line plot.
import matplotlib.pyplot as plt

x = [1, 2, 3, 4]
y = [10, 20, 25, 30]

plt.plot(x, y, label='Data from how2matplotlib.com')
plt.xlabel('X Axis - how2matplotlib.com')
plt.ylabel('Y Axis - how2matplotlib.com')
plt.title('Simple Plot - how2matplotlib.com')
plt.legend()
plt.show()
Output:
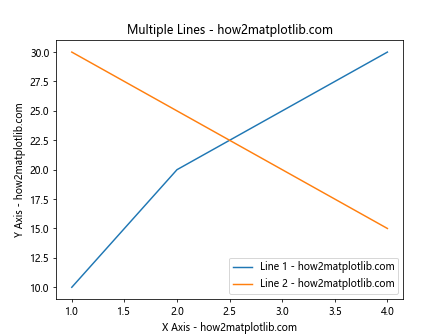
Example 2: Multiple Lines on the Same Plot
Here, we add multiple lines to the same plot, each with a unique label.
import matplotlib.pyplot as plt

x = range(1, 5)
y1 = [10, 20, 25, 30]
y2 = [30, 25, 20, 15]

plt.plot(x, y1, label='Line 1 - how2matplotlib.com')
plt.plot(x, y2, label='Line 2 - how2matplotlib.com')
plt.xlabel('X Axis - how2matplotlib.com')
plt.ylabel('Y Axis - how2matplotlib.com')
plt.title('Multiple Lines - how2matplotlib.com')
plt.legend()
plt.show()
Output:
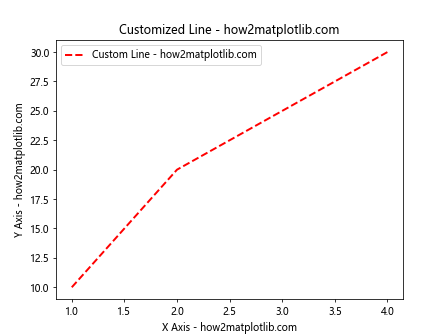
Example 3: Customizing Line Styles and Colors
This example shows how to customize line styles and colors.
import matplotlib.pyplot as plt

x = range(1, 5)
y = [10, 20, 25, 30]

plt.plot(x, y, color='red', linestyle='--', linewidth=2, label='Custom Line - how2matplotlib.com')
plt.xlabel('X Axis - how2matplotlib.com')
plt.ylabel('Y Axis - how2matplotlib.com')
plt.title('Customized Line - how2matplotlib.com')
plt.legend()
plt.show()
Output:
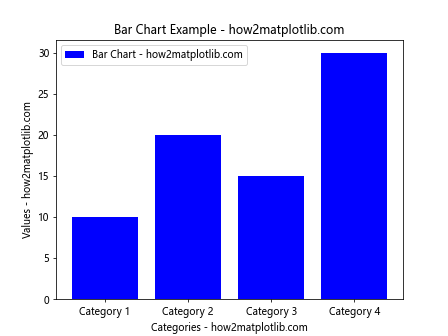
Example 4: Creating Bar Charts
Creating a bar chart to represent data visually.
import matplotlib.pyplot as plt

categories = ['Category 1', 'Category 2', 'Category 3', 'Category 4']
values = [10, 20, 15, 30]

plt.bar(categories, values, color='blue', label='Bar Chart - how2matplotlib.com')
plt.xlabel('Categories - how2matplotlib.com')
plt.ylabel('Values - how2matplotlib.com')
plt.title('Bar Chart Example - how2matplotlib.com')
plt.legend()
plt.show()
Output:
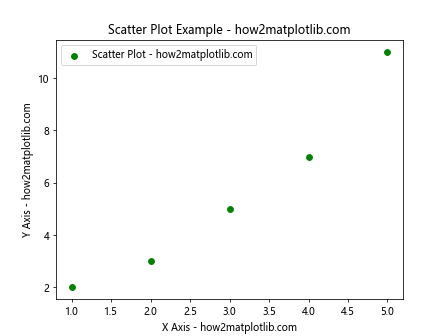
Example 5: Plotting Scatter Plots
This example illustrates how to create a scatter plot.
import matplotlib.pyplot as plt

x = [1, 2, 3, 4, 5]
y = [2, 3, 5, 7, 11]

plt.scatter(x, y, color='green', label='Scatter Plot - how2matplotlib.com')
plt.xlabel('X Axis - how2matplotlib.com')
plt.ylabel('Y Axis - how2matplotlib.com')
plt.title('Scatter Plot Example - how2matplotlib.com')
plt.legend()
plt.show()
Output:
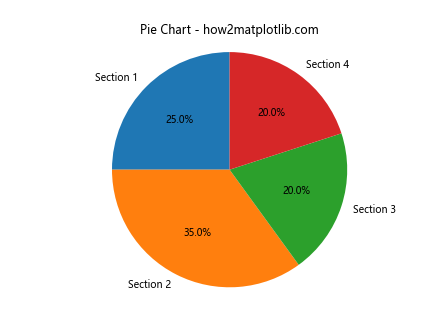
Example 6: Pie Charts
Demonstrating how to create a pie chart with Matplotlib.
import matplotlib.pyplot as plt

sizes = [25, 35, 20, 20]
labels = ['Section 1', 'Section 2', 'Section 3', 'Section 4']

plt.pie(sizes, labels=labels, autopct='%1.1f%%', startangle=90)
plt.title('Pie Chart - how2matplotlib.com')
plt.axis('equal')  # Equal aspect ratio ensures the pie chart is circular.
plt.show()
Output:
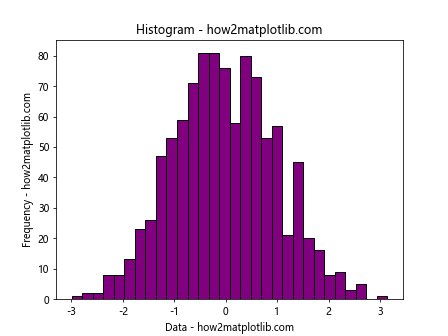
Example 7: Working with Histograms
Creating a histogram to show distribution of data.
import matplotlib.pyplot as plt
import numpy as np

data = np.random.randn(1000)

plt.hist(data, bins=30, color='purple', edgecolor='black')
plt.title('Histogram - how2matplotlib.com')
plt.xlabel('Data - how2matplotlib.com')
plt.ylabel('Frequency - how2matplotlib.com')
plt.show()
Output:
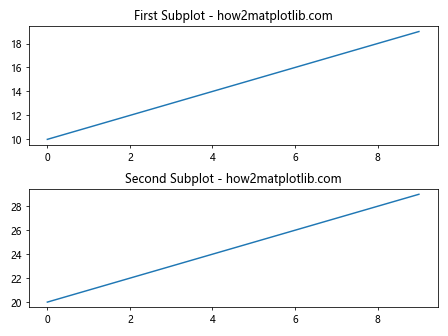
Example 8: Subplots
Using subplots to create multiple plots in one figure.
import matplotlib.pyplot as plt

# First subplot
plt.subplot(2, 1, 1)  # (rows, columns, panel number)
plt.plot(range(0, 10), range(10, 20), label='Line 1 - how2matplotlib.com')
plt.title('First Subplot - how2matplotlib.com')

# Second subplot
plt.subplot(2, 1, 2)
plt.plot(range(0, 10), range(20, 30), label='Line 2 - how2matplotlib.com')
plt.title('Second Subplot - how2matplotlib.com')

plt.tight_layout()
plt.show()
Output:
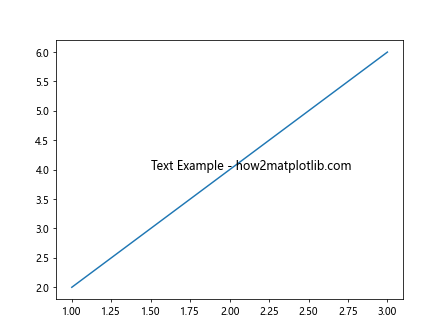
Example 9: Adding Text to Plots
This example shows how to add text within the plot area.
import matplotlib.pyplot as plt

plt.plot([1, 2, 3], [2, 4, 6])
plt.text(1.5, 4, 'Text Example - how2matplotlib.com', fontsize=12)
plt.show()
Output:
Example 10: Customizing Ticks
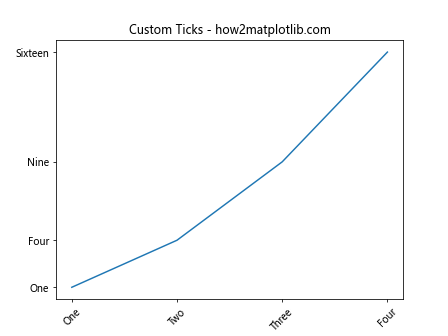
Customizing the appearance of ticks on the axes.
import matplotlib.pyplot as plt

plt.plot([1, 2, 3, 4], [1, 4, 9, 16])
plt.xticks([1, 2, 3, 4], ['One', 'Two', 'Three', 'Four'], rotation=45)
plt.yticks([1, 4, 9, 16], ['One', 'Four', 'Nine', 'Sixteen'])
plt.title('Custom Ticks - how2matplotlib.com')
plt.show()
Output:
Conclusion
Matplotlib is a powerful tool for creating a wide variety of plots and visualizations in Python. This article has introduced the basic units of Matplotlib, including figures, axes, lines, and markers, through a series of examples. Each example provided a complete, standalone code snippet, demonstrating different features and customization options available in Matplotlib. By understanding these basic units and how to manipulate them, you can start creating informative and attractive visualizations for your data analysis and presentation needs. Remember, practice is key to mastering Matplotlib, so experiment with these examples and explore the library’s extensive documentation to discover more advanced features and techniques.