Matplotlib Autoscaling
Matplotlib is a comprehensive library for creating static, animated, and interactive visualizations in Python. One of its powerful features is autoscaling, which automatically adjusts the scale of axes in a plot to fit the data or to enhance the visualization. This feature is particularly useful when dealing with dynamic datasets where the range of data values can vary widely. In this article, we will explore the autoscaling feature of Matplotlib in detail, providing a series of examples that demonstrate how to use it effectively in different scenarios.
Understanding Autoscaling
Autoscaling in Matplotlib refers to the automatic adjustment of the limits of axes in a plot based on the data or specific settings provided by the user. This ensures that the data is presented in the most readable and visually appealing way without the need for manual adjustments of the axes limits.
The autoscaling behavior can be controlled using various functions and parameters in Matplotlib. For instance, the autoscale_view() function of the axes object can be used to adjust the view limits dynamically. Additionally, the set_autoscale_on() method can enable or disable autoscaling for specific axes.
Examples of Matplotlib Autoscaling
Below are examples demonstrating how to use autoscaling in Matplotlib. Each example is a standalone code snippet that can be run independently to understand different aspects of autoscaling.
Example 1: Basic Autoscaling
import matplotlib.pyplot as plt

x = range(1, 11)
y = [i**2 for i in x]

plt.plot(x, y)
plt.title("Basic Autoscaling Example - how2matplotlib.com")
plt.xlabel("X-axis")
plt.ylabel("Y-axis")
plt.autoscale(enable=True, axis='both', tight=None)
plt.show()
Output:
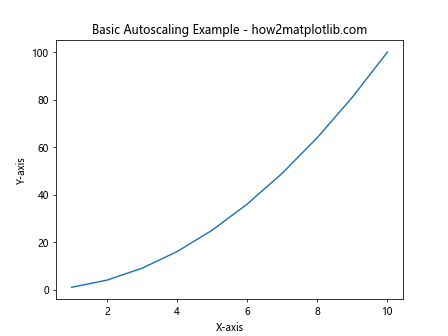
Example 2: Disabling Autoscaling
import matplotlib.pyplot as plt

x = range(1, 6)
y = [2**i for i in x]

plt.plot(x, y)
plt.title("Disabling Autoscaling - how2matplotlib.com")
plt.xlabel("X-axis")
plt.ylabel("Y-axis")
plt.autoscale(enable=False)
plt.show()
Output:
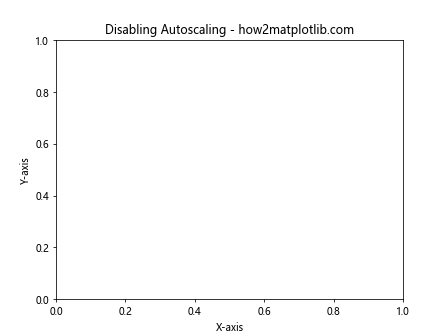
Example 3: Autoscaling with Tight Layout
import matplotlib.pyplot as plt

x = range(1, 11)
y = [i**2.5 for i in x]

plt.plot(x, y)
plt.title("Autoscaling with Tight Layout - how2matplotlib.com")
plt.xlabel("X-axis")
plt.ylabel("Y-axis")
plt.autoscale(tight=True)
plt.show()
Output:
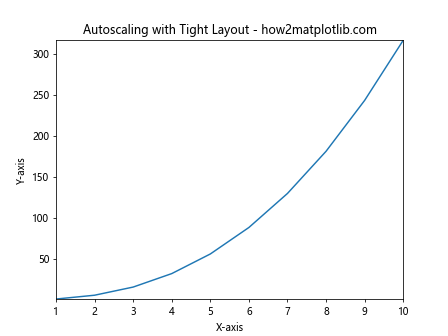
Example 4: Autoscaling on X-axis Only
import matplotlib.pyplot as plt

x = range(1, 11)
y = [i**3 for i in x]

plt.plot(x, y)
plt.title("Autoscaling on X-axis Only - how2matplotlib.com")
plt.xlabel("X-axis")
plt.ylabel("Y-axis")
plt.autoscale(enable=True, axis='x')
plt.show()
Output:
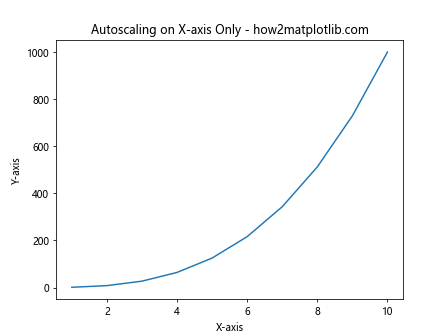
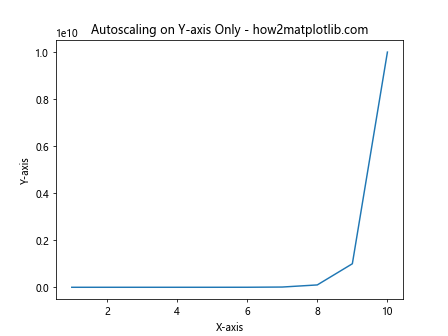
Example 5: Autoscaling on Y-axis Only
import matplotlib.pyplot as plt

x = range(1, 11)
y = [10**i for i in x]

plt.plot(x, y)
plt.title("Autoscaling on Y-axis Only - how2matplotlib.com")
plt.xlabel("X-axis")
plt.ylabel("Y-axis")
plt.autoscale(enable=True, axis='y')
plt.show()
Output:
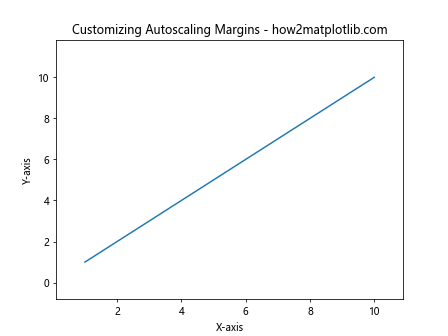
Example 6: Customizing Autoscaling Margins
import matplotlib.pyplot as plt

x = range(1, 11)
y = [i for i in x]

plt.plot(x, y)
plt.title("Customizing Autoscaling Margins - how2matplotlib.com")
plt.xlabel("X-axis")
plt.ylabel("Y-axis")
plt.margins(x=0.1, y=0.2)
plt.show()
Output:
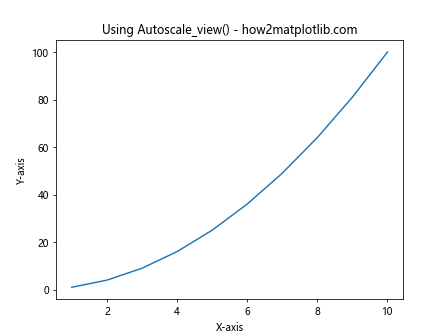
Example 7: Using Autoscale_view()
import matplotlib.pyplot as plt

x = range(1, 11)
y = [i**2 for i in x]

fig, ax = plt.subplots()
ax.plot(x, y)
ax.set_title("Using Autoscale_view() - how2matplotlib.com")
ax.set_xlabel("X-axis")
ax.set_ylabel("Y-axis")
ax.autoscale_view()
plt.show()
Output:
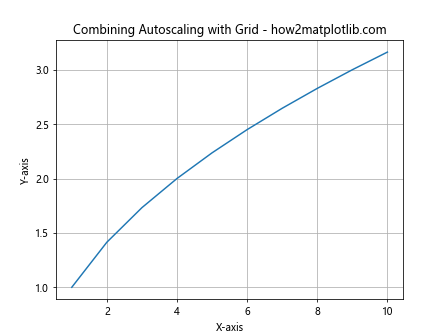
Example 8: Combining Autoscaling with Grid
import matplotlib.pyplot as plt

x = range(1, 11)
y = [i**0.5 for i in x]

plt.plot(x, y)
plt.title("Combining Autoscaling with Grid - how2matplotlib.com")
plt.xlabel("X-axis")
plt.ylabel("Y-axis")
plt.grid(True)
plt.autoscale(enable=True, axis='both')
plt.show()
Output:
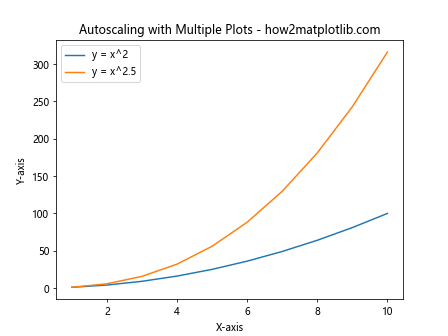
Example 9: Autoscaling with Multiple Plots
import matplotlib.pyplot as plt

x = range(1, 11)
y1 = [i**2 for i in x]
y2 = [i**2.5 for i in x]

plt.plot(x, y1, label='y = x^2')
plt.plot(x, y2, label='y = x^2.5')
plt.title("Autoscaling with Multiple Plots - how2matplotlib.com")
plt.xlabel("X-axis")
plt.ylabel("Y-axis")
plt.legend()
plt.autoscale(enable=True, axis='both')
plt.show()
Output:
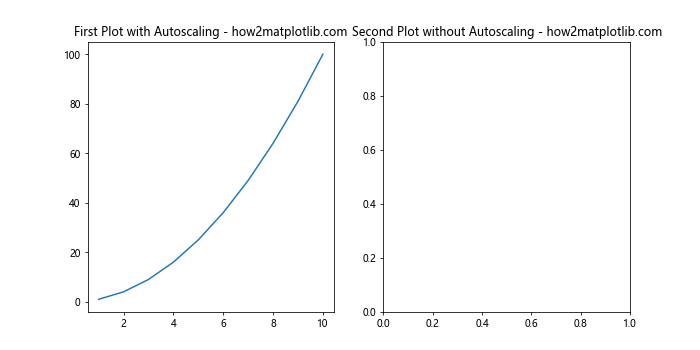
Example 10: Disabling Autoscaling for Specific Axes
import matplotlib.pyplot as plt

fig, axs = plt.subplots(1, 2, figsize=(10, 5))

x = range(1, 11)
y = [i**2 for i in x]

axs[0].plot(x, y)
axs[0].set_title("First Plot with Autoscaling - how2matplotlib.com")
axs[0].autoscale(enable=True)

axs[1].plot(x, y)
axs[1].set_title("Second Plot without Autoscaling - how2matplotlib.com")
axs[1].autoscale(enable=False)

plt.show()
Output:
These examples cover a wide range of scenarios where autoscaling can be applied in Matplotlib. By understanding and utilizing autoscaling, you can create plots that are not only visually appealing but also accurately represent your data without the need for manual adjustments. Whether you are working with simple line plots or complex visualizations involving multiple datasets, autoscaling is a feature that can significantly enhance the readability and effectiveness of your plots.