Comprehensive Guide to Matplotlib.artist.Artist.get_window_extent() in Python
Matplotlib.artist.Artist.get_window_extent() in Python is a powerful method used to retrieve the bounding box of an artist in window coordinates. This function is essential for determining the exact position and size of various elements in a Matplotlib plot. In this comprehensive guide, we’ll explore the intricacies of Matplotlib.artist.Artist.get_window_extent() in Python, providing detailed explanations and practical examples to help you master this crucial aspect of Matplotlib.
Understanding Matplotlib.artist.Artist.get_window_extent() in Python
Matplotlib.artist.Artist.get_window_extent() in Python is a method that belongs to the Artist class in Matplotlib. It returns a Bbox object representing the bounding box of the artist in window (pixel) coordinates. This method is particularly useful when you need to determine the exact position and dimensions of an artist within the figure window.
Let’s start with a simple example to demonstrate how to use Matplotlib.artist.Artist.get_window_extent() in Python:
import matplotlib.pyplot as plt

fig, ax = plt.subplots()
text = ax.text(0.5, 0.5, "how2matplotlib.com", ha='center', va='center')
bbox = text.get_window_extent()
print(f"Bounding box: {bbox}")

plt.show()
Output:
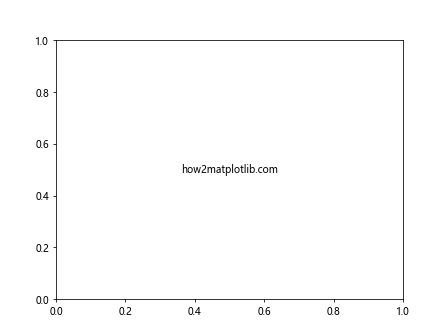
In this example, we create a text artist and use Matplotlib.artist.Artist.get_window_extent() in Python to retrieve its bounding box. The returned Bbox object contains the coordinates of the box in window coordinates.
The Importance of Matplotlib.artist.Artist.get_window_extent() in Python
Matplotlib.artist.Artist.get_window_extent() in Python plays a crucial role in various scenarios:
- Precise positioning of elements
- Avoiding overlaps between artists
- Creating custom layouts
- Implementing interactive features
Let’s explore each of these use cases with examples.
Precise Positioning with Matplotlib.artist.Artist.get_window_extent() in Python
When you need to position elements accurately relative to each other, Matplotlib.artist.Artist.get_window_extent() in Python becomes invaluable. Here’s an example that demonstrates how to use this method to position a text label above a bar in a bar chart:
import matplotlib.pyplot as plt

fig, ax = plt.subplots()
bar = ax.bar(["how2matplotlib.com"], [10])
bbox = bar[0].get_window_extent()

label = ax.text(bbox.x0 + bbox.width/2, bbox.y1 + 5, "Label", ha='center', va='bottom')

plt.show()
Output:
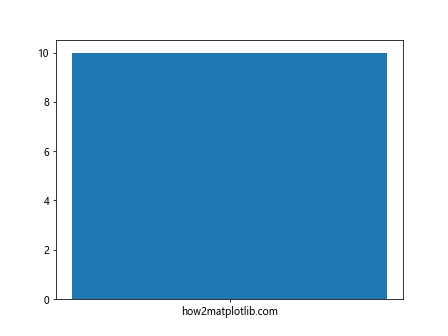
In this example, we use Matplotlib.artist.Artist.get_window_extent() in Python to get the bounding box of the bar and position the label above it.
Avoiding Overlaps with Matplotlib.artist.Artist.get_window_extent() in Python
Matplotlib.artist.Artist.get_window_extent() in Python can help prevent overlapping elements in your plots. Here’s an example that adjusts the position of labels to avoid overlap:
import matplotlib.pyplot as plt

fig, ax = plt.subplots()
bars = ax.bar(["A", "B", "C"], [10, 20, 15])

for bar in bars:
    height = bar.get_height()
    label = ax.text(bar.get_x() + bar.get_width()/2, height, f"{height}", ha='center', va='bottom')

    bbox = label.get_window_extent()
    if bbox.y0 < bar.get_window_extent().y1:
        label.set_y(height + 1)

plt.show()
Output:
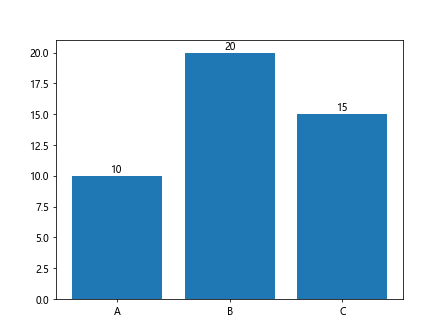
In this example, we use Matplotlib.artist.Artist.get_window_extent() in Python to check if the label overlaps with the bar and adjust its position if necessary.
Custom Layouts with Matplotlib.artist.Artist.get_window_extent() in Python
Matplotlib.artist.Artist.get_window_extent() in Python can be used to create custom layouts. Here's an example that creates a grid of subplots with varying sizes based on their content:
import matplotlib.pyplot as plt
import numpy as np

fig = plt.figure(figsize=(10, 10))

data = [np.random.rand(10, 10) for _ in range(4)]
titles = ["how2matplotlib.com A", "how2matplotlib.com B", "how2matplotlib.com C", "how2matplotlib.com D"]

axes = []
for i, (d, t) in enumerate(zip(data, titles)):
    ax = fig.add_subplot(2, 2, i+1)
    im = ax.imshow(d)
    ax.set_title(t)
    axes.append(ax)

for ax in axes:
    bbox = ax.get_window_extent()
    ax.set_position([bbox.x0/fig.dpi, bbox.y0/fig.dpi, bbox.width/fig.dpi, bbox.height/fig.dpi])

plt.tight_layout()
plt.show()
In this example, we use Matplotlib.artist.Artist.get_window_extent() in Python to adjust the position and size of each subplot based on its content.
Interactive Features with Matplotlib.artist.Artist.get_window_extent() in Python
Matplotlib.artist.Artist.get_window_extent() in Python is particularly useful when implementing interactive features. Here's an example that creates a clickable legend:
import matplotlib.pyplot as plt

fig, ax = plt.subplots()
lines = ax.plot(range(10), range(10), label="how2matplotlib.com Line 1")
lines += ax.plot(range(10), [i*2 for i in range(10)], label="how2matplotlib.com Line 2")

legend = ax.legend()

def on_click(event):
    for line, text in zip(lines, legend.get_texts()):
        if text.get_window_extent().contains(event.x, event.y):
            line.set_visible(not line.get_visible())
            text.set_alpha(1.0 if line.get_visible() else 0.2)
    fig.canvas.draw()

fig.canvas.mpl_connect('button_press_event', on_click)
plt.show()
Output:
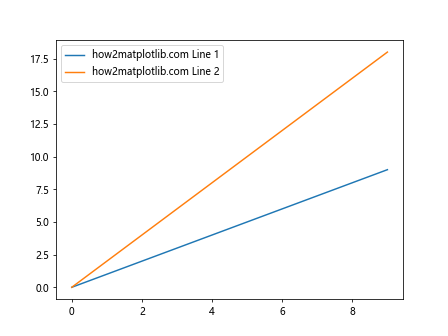
In this example, we use Matplotlib.artist.Artist.get_window_extent() in Python to determine if a click event occurred within the bounding box of a legend item.
Advanced Usage of Matplotlib.artist.Artist.get_window_extent() in Python
Now that we've covered the basics, let's explore some advanced uses of Matplotlib.artist.Artist.get_window_extent() in Python.
Transformations and Matplotlib.artist.Artist.get_window_extent() in Python
Matplotlib.artist.Artist.get_window_extent() in Python returns coordinates in window (pixel) space. Sometimes, you might need to convert these coordinates to other coordinate systems. Here's an example that demonstrates how to convert window coordinates to data coordinates:
import matplotlib.pyplot as plt

fig, ax = plt.subplots()
line, = ax.plot([0, 1], [0, 1], label="how2matplotlib.com")
legend = ax.legend()

bbox = legend.get_window_extent()
data_bbox = bbox.transformed(ax.transData.inverted())

print(f"Legend bounds in data coordinates: {data_bbox}")

plt.show()
Output:
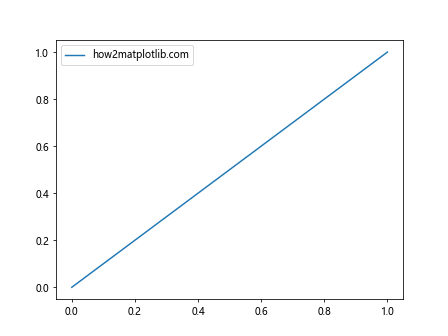
In this example, we use the transformed method along with Matplotlib.artist.Artist.get_window_extent() in Python to convert the legend's bounding box from window coordinates to data coordinates.
Clipping with Matplotlib.artist.Artist.get_window_extent() in Python
Matplotlib.artist.Artist.get_window_extent() in Python can be used to implement custom clipping. Here's an example that clips a text artist to stay within the axes:
import matplotlib.pyplot as plt
from matplotlib.patches import Rectangle

fig, ax = plt.subplots()
text = ax.text(0.5, 0.5, "how2matplotlib.com" * 10, ha='center', va='center', wrap=True)

bbox = text.get_window_extent()
rect = Rectangle((bbox.x0, bbox.y0), bbox.width, bbox.height, fill=False, ec='r')
ax.add_patch(rect)

ax_bbox = ax.get_window_extent()
text.set_clip_box(ax_bbox)

plt.show()
Output:
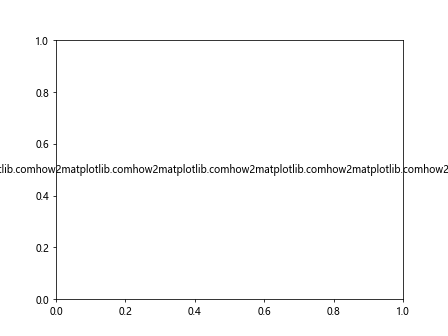
In this example, we use Matplotlib.artist.Artist.get_window_extent() in Python to get the bounding box of both the text and the axes, and then use this information to clip the text.
Dynamic Resizing with Matplotlib.artist.Artist.get_window_extent() in Python
Matplotlib.artist.Artist.get_window_extent() in Python can be used to implement dynamic resizing of plot elements. Here's an example that resizes a text box based on its content:
import matplotlib.pyplot as plt
from matplotlib.patches import FancyBboxPatch

fig, ax = plt.subplots()
text = ax.text(0.5, 0.5, "how2matplotlib.com", ha='center', va='center', bbox=dict(boxstyle='round', fc='w', ec='k'))

def update_bbox(event):
    bbox = text.get_window_extent()
    text_box = FancyBboxPatch((bbox.x0, bbox.y0), bbox.width, bbox.height, boxstyle='round', fc='w', ec='k')
    ax.add_patch(text_box)
    fig.canvas.draw()

fig.canvas.mpl_connect('resize_event', update_bbox)
plt.show()
Output:
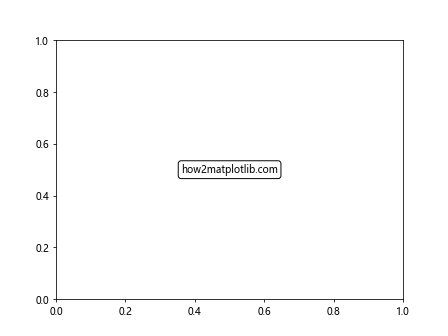
In this example, we use Matplotlib.artist.Artist.get_window_extent() in Python to dynamically update the size of a text box when the figure is resized.
Best Practices for Using Matplotlib.artist.Artist.get_window_extent() in Python
When working with Matplotlib.artist.Artist.get_window_extent() in Python, keep these best practices in mind:
- Always call Matplotlib.artist.Artist.get_window_extent() in Python after the figure has been drawn to ensure accurate results.
- Be aware that the returned coordinates are in window (pixel) space, which may not always be suitable for your needs.
- Use transformations when necessary to convert between coordinate systems.
- Remember that Matplotlib.artist.Artist.get_window_extent() in Python returns a Bbox object, which has useful properties and methods for working with bounding boxes.
Here's an example that demonstrates these best practices:
import matplotlib.pyplot as plt

fig, ax = plt.subplots()
text = ax.text(0.5, 0.5, "how2matplotlib.com", ha='center', va='center')

plt.draw()  # Ensure the figure is drawn before getting the window extent

bbox = text.get_window_extent()
print(f"Window coordinates: {bbox}")

data_bbox = bbox.transformed(ax.transData.inverted())
print(f"Data coordinates: {data_bbox}")

center_x = (bbox.x0 + bbox.x1) / 2
center_y = (bbox.y0 + bbox.y1) / 2
print(f"Center point: ({center_x}, {center_y})")

plt.show()
Output:
This example demonstrates how to properly use Matplotlib.artist.Artist.get_window_extent() in Python, convert coordinates, and work with the returned Bbox object.
Common Pitfalls and Solutions when Using Matplotlib.artist.Artist.get_window_extent() in Python
While Matplotlib.artist.Artist.get_window_extent() in Python is a powerful tool, there are some common pitfalls to be aware of:
- Getting incorrect results due to calling the method before the figure is drawn
- Confusion between different coordinate systems
- Issues with tight layout and constrained layout
Let's address each of these pitfalls with examples and solutions.
Pitfall 1: Calling Matplotlib.artist.Artist.get_window_extent() in Python Too Early
If you call Matplotlib.artist.Artist.get_window_extent() in Python before the figure is drawn, you may get incorrect results. Here's an example that demonstrates this issue and how to solve it:
import matplotlib.pyplot as plt

fig, ax = plt.subplots()
text = ax.text(0.5, 0.5, "how2matplotlib.com", ha='center', va='center')

# Incorrect: calling get_window_extent() before drawing
bbox_before = text.get_window_extent()
print(f"Before drawing: {bbox_before}")

plt.draw()  # Draw the figure

# Correct: calling get_window_extent() after drawing
bbox_after = text.get_window_extent()
print(f"After drawing: {bbox_after}")

plt.show()
Output:
In this example, we demonstrate the difference between calling Matplotlib.artist.Artist.get_window_extent() in Python before and after drawing the figure.
Pitfall 2: Confusion Between Coordinate Systems
Matplotlib uses multiple coordinate systems, and it's easy to get confused when working with Matplotlib.artist.Artist.get_window_extent() in Python. Here's an example that demonstrates how to work with different coordinate systems:
import matplotlib.pyplot as plt

fig, ax = plt.subplots()
text = ax.text(0.5, 0.5, "how2matplotlib.com", ha='center', va='center', transform=ax.transAxes)

plt.draw()

window_bbox = text.get_window_extent()
print(f"Window coordinates: {window_bbox}")

axes_bbox = window_bbox.transformed(ax.transAxes.inverted())
print(f"Axes coordinates: {axes_bbox}")

data_bbox = window_bbox.transformed(ax.transData.inverted())
print(f"Data coordinates: {data_bbox}")

plt.show()
Output:
This example shows how to convert the bounding box returned by Matplotlib.artist.Artist.get_window_extent() in Python to different coordinate systems.
Pitfall 3: Issues with Tight Layout and Constrained Layout
When using tight_layout or constrained_layout, the positions of artists may change after the initial draw. Here's an example that demonstrates how to handle this:
import matplotlib.pyplot as plt

fig, ax = plt.subplots(constrained_layout=True)
text = ax.text(0.5, 0.5, "how2matplotlib.com", ha='center', va='center', transform=ax.transAxes)

plt.draw()
bbox_before = text.get_window_extent()
print(f"Before tight_layout: {bbox_before}")

fig.tight_layout()
plt.draw()
bbox_after = text.get_window_extent()
print(f"After tight_layout: {bbox_after}")

plt.show()
Output:
This example shows how to get accurate results when using Matplotlib.artist.Artist.get_window_extent() in Python with tight_layout or constrained_layout.
Advanced Techniques with Matplotlib.artist.Artist.get_window_extent() in Python
Now that we've covered the basics and common pitfalls, let's explore some advanced techniques using Matplotlib.artist.Artist.get_window_extent() in Python.
Creating Custom Legends with Matplotlib.artist.Artist.get_window_extent() in Python
You can use Matplotlib.artist.Artist.get_window_extent() in Python to create custom legends that adapt to the size of their content. Here's an example:
import matplotlib.pyplot as plt
from matplotlib.patches import Rectangle

fig, ax = plt.subplots()
ax.plot([0, 1], [0, 1], label="how2matplotlib.com Line 1")
ax.plot([0, 1], [1, 0], label="how2matplotlib.com Line 2")

legend = ax.legend(loc='center left', bbox_to_anchor=(1, 0.5))
plt.draw()

legend_bbox = legend.get_window_extent()
fig_bbox = fig.get_window_extent()

new_width = (fig_bbox.width + legend_bbox.width) / fig_bbox.width
fig.set_size_inches(fig.get_size_inches()[0] * new_width, fig.get_size_inches()[1])

plt.draw()
plt.show()
Output:
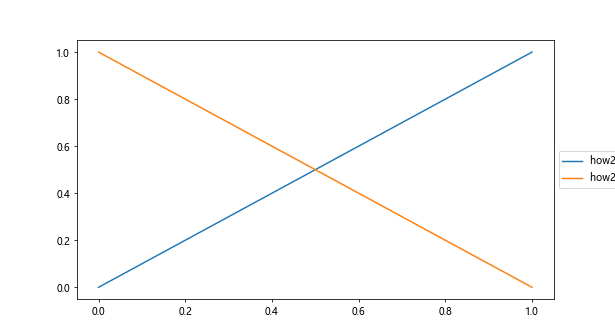
In this example, we use Matplotlib.artist.Artist.get_window_extent() in Python to adjust the figure size to accommodate a custom legend placement.
Implementing Zoom Functionality with Matplotlib.artist.Artist.get_window_extent() in Python
Matplotlib.artist.Artist.get_window_extent() in Python can be used to implement custom zoom functionality. Here's an example:
import matplotlib.pyplot as plt
from matplotlib.patches import Rectangle

fig, ax = plt.subplots()
ax.plot([0, 1, 2, 3, 4], [0, 1, 4, 9, 16], label="how2matplotlib.com")

zoom_rect = Rectangle((0, 0), 0, 0, fill=False, ec='r')
ax.add_patch(zoom_rect)

def on_press(event):
    global start_x, start_y
    start_x, start_y = event.xdata, event.ydata

def on_release(event):
    global start_x, start_y
    end_x, end_y = event.xdata, event.ydata
    ax.set_xlim(min(start_x, end_x), max(start_x, end_x))
    ax.set_ylim(min(start_y, end_y), max(start_y, end_y))
    zoom_rect.set_width(0)
    zoom_rect.set_height(0)
    fig.canvas.draw()

def on_motion(event):
    if event.button != 1:
        return
    zoom_rect.set_xy((start_x, start_y))
    zoom_rect.set_width(event.xdata - start_x)
    zoom_rect.set_height(event.ydata - start_y)
    fig.canvas.draw()

fig.canvas.mpl_connect('button_press_event', on_press)
fig.canvas.mpl_connect('button_release_event', on_release)
fig.canvas.mpl_connect('motion_notify_event', on_motion)

plt.show()
Output:
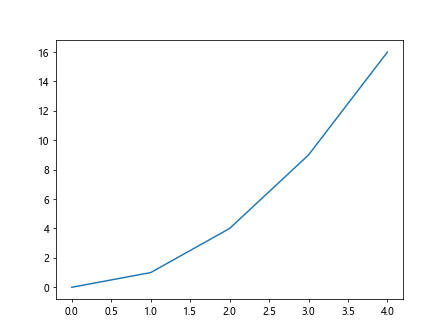
In this example, we use Matplotlib.artist.Artist.get_window_extent() in Python indirectly through the event handling to implement a custom zoom functionality.
Creating Adaptive Annotations with Matplotlib.artist.Artist.get_window_extent() in Python
Matplotlib.artist.Artist.get_window_extent() in Python can be used to create annotations that adapt to the content they're annotating. Here's an example:
import matplotlib.pyplot as plt
from matplotlib.patches import FancyArrowPatch

fig, ax = plt.subplots()
line, = ax.plot([0, 1, 2, 3, 4], [0, 1, 4, 9, 16], label="how2matplotlib.com")

def adaptive_annotate(x, y, text):
    annotation = ax.annotate(text, (x, y), xytext=(10, 10), textcoords='offset points',
                             bbox=dict(boxstyle='round', fc='w', ec='k'),
                             arrowprops=dict(arrowstyle='->'))

    plt.draw()

    ann_bbox = annotation.get_window_extent()
    point_bbox = ax.transData.transform((x, y))

    if ann_bbox.x1 > fig.get_window_extent().x1:
        annotation.xytext = (-10, 10)
        annotation.set_ha('right')

    if ann_bbox.y1 > fig.get_window_extent().y1:
        annotation.xytext = (10, -10)
        annotation.set_va('top')

    fig.canvas.draw()

adaptive_annotate(2, 4, "Peak")
adaptive_annotate(4, 16, "End point")

plt.show()
Output:
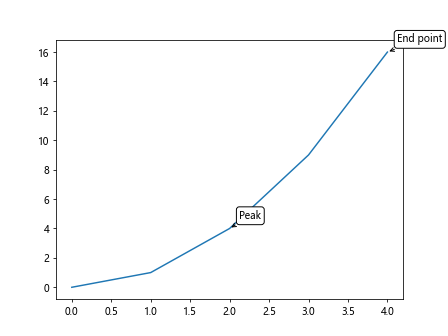
In this example, we use Matplotlib.artist.Artist.get_window_extent() in Python to adjust the position of annotations based on their content and the figure boundaries.
Optimizing Performance with Matplotlib.artist.Artist.get_window_extent() in Python
When working with large datasets or complex visualizations, efficient use of Matplotlib.artist.Artist.get_window_extent() in Python becomes crucial. Here are some tips to optimize performance:
- Cache results when possible
- Use blitting for faster updates
- Limit the frequency of calls to Matplotlib.artist.Artist.get_window_extent() in Python
Let's look at an example that implements these optimizations:
import matplotlib.pyplot as plt
import numpy as np
from matplotlib.backends.backend_agg import FigureCanvasAgg

fig, ax = plt.subplots()
line, = ax.plot(np.random.rand(100), label="how2matplotlib.com")
ax.set_title("Performance Optimization Example")

canvas = FigureCanvasAgg(fig)
background = canvas.copy_from_bbox(fig.bbox)

cached_bbox = None

def update_annotation(event):
    global cached_bbox

    if event.inaxes != ax:
        return

    x, y = event.xdata, event.ydata
    annotation = ax.annotate(f"({x:.2f}, {y:.2f})", (x, y), xytext=(10, 10), textcoords='offset points',
                             bbox=dict(boxstyle='round', fc='w', ec='k'),
                             arrowprops=dict(arrowstyle='->'))

    canvas.restore_region(background)

    if cached_bbox is None or not cached_bbox.contains(event.x, event.y):
        plt.draw()
        cached_bbox = annotation.get_window_extent()

    ax.draw_artist(annotation)
    canvas.blit(fig.bbox)

    annotation.remove()

fig.canvas.mpl_connect('motion_notify_event', update_annotation)

plt.show()
Output:
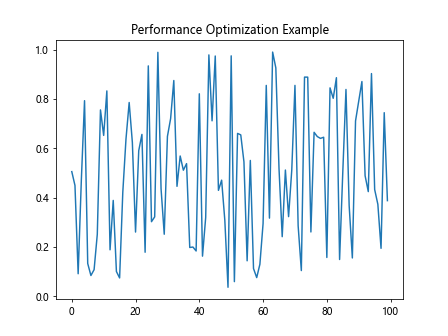
In this example, we use caching, blitting, and limit the frequency of calls to Matplotlib.artist.Artist.get_window_extent() in Python to optimize performance when creating dynamic annotations.
Conclusion: Mastering Matplotlib.artist.Artist.get_window_extent() in Python
Throughout this comprehensive guide, we've explored the various aspects of Matplotlib.artist.Artist.get_window_extent() in Python. We've covered its basic usage, advanced techniques, common pitfalls, and performance optimizations. By mastering this powerful method, you'll be able to create more dynamic, interactive, and precisely positioned visualizations using Matplotlib.