Matplotlib 3D Plot
Matplotlib is a widely used plotting library in Python, known for its flexibility and ease of use. In this article, we will explore how to create 3D plots using Matplotlib. 3D plots are perfect for visualizing data in three dimensions, providing a more comprehensive view compared to 2D plots. We will cover various types of 3D plots, such as scatter plots, surface plots, and wireframe plots.
1. Scatter Plot
A scatter plot is a type of 3D plot that represents individual data points using markers. We can create a 3D scatter plot using the Axes3D class from Matplotlib.
import matplotlib.pyplot as plt
from mpl_toolkits.mplot3d import Axes3D

fig = plt.figure()
ax = fig.add_subplot(111, projection='3d')

# Dataset
x = [1, 2, 3, 4, 5]
y = [5, 4, 3, 2, 1]
z = [1, 2, 3, 4, 5]

# Plot
ax.scatter(x, y, z)

plt.show()
Output:
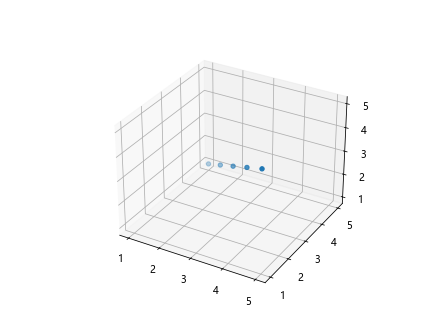
In the above code, we first create a figure and a 3D subplot using the add_subplot method. We then define our dataset x, y, and z, and plot them using the scatter method. Running this code will generate a 3D scatter plot.
2. Surface Plot
A surface plot is a type of 3D plot that visualizes a smooth, continuous surface. We can create a surface plot using the plot_surface method available in Matplotlib.
import numpy as np
import matplotlib.pyplot as plt
from mpl_toolkits.mplot3d import Axes3D

fig = plt.figure()
ax = fig.add_subplot(111, projection='3d')

# Data generation
X = np.linspace(-5, 5, 100)
Y = np.linspace(-5, 5, 100)
X, Y = np.meshgrid(X, Y)
Z = np.sin(np.sqrt(X**2 + Y**2))

# Plot
ax.plot_surface(X, Y, Z, cmap='viridis')

plt.show()
Output:
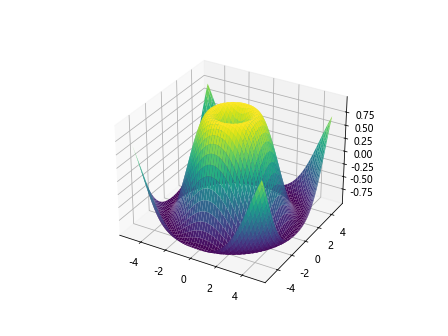
In the above code, we generate data using numpy to create a surface plot of a sine function. We plot the surface using the plot_surface method and specify the colormap as viridis for better visualization. Running this code will display a 3D surface plot.
3. Wireframe Plot
A wireframe plot is a type of 3D plot that displays a three-dimensional object by connecting points with straight lines. We can create a wireframe plot using the plot_wireframe method in Matplotlib.
import numpy as np
import matplotlib.pyplot as plt
from mpl_toolkits.mplot3d import Axes3D

fig = plt.figure()
ax = fig.add_subplot(111, projection='3d')

# Data generation
X = np.linspace(-5, 5, 100)
Y = np.linspace(-5, 5, 100)
X, Y = np.meshgrid(X, Y)
Z = np.sin(np.sqrt(X**2 + Y**2))

# Plot
ax.plot_wireframe(X, Y, Z)

plt.show()
Output:
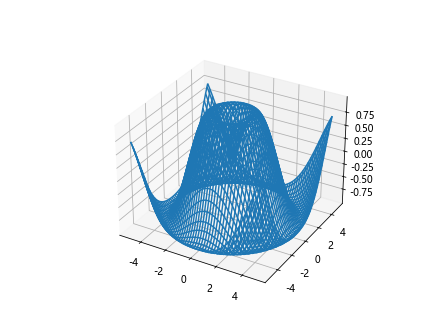
In this code snippet, we reuse the data generation process from the surface plot example to create a wireframe plot of a sine function. We use the plot_wireframe method to plot the wireframe of the surface. Running this code will display a 3D wireframe plot.
4. Contour Plot
A contour plot is a type of 3D plot that shows the level curves of a function in two variables. We can create a contour plot using the contour method in Matplotlib.
import numpy as np
import matplotlib.pyplot as plt
from mpl_toolkits.mplot3d import Axes3D

fig = plt.figure()
ax = fig.add_subplot(111, projection='3d')

# Data generation
X = np.linspace(-5, 5, 100)
Y = np.linspace(-5, 5, 100)
X, Y = np.meshgrid(X, Y)
Z = np.sin(np.sqrt(X**2 + Y**2))

# Plot
ax.contour(X, Y, Z, 50, cmap='viridis')

plt.show()
Output:
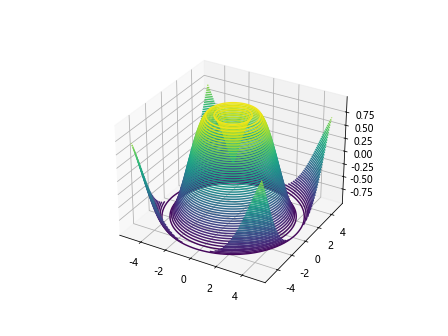
In this code snippet, we use the same data generation process as the surface and wireframe plots. We then plot the contour of the surface using the contour method with 50 contour levels and the viridis colormap. Running this code will display a 3D contour plot.
5. Multiple 3D Plots
We can create multiple 3D plots in the same figure for comparison or visual analysis. Let’s create two scatter plots in the same figure.
import numpy as np
import matplotlib.pyplot as plt
from mpl_toolkits.mplot3d import Axes3D

fig = plt.figure(figsize=(12, 6))

# First subplot
ax1 = fig.add_subplot(121, projection='3d')
x1 = np.random.rand(100)
y1 = np.random.rand(100)
z1 = np.random.rand(100)
ax1.scatter(x1, y1, z1)

# Second subplot
ax2 = fig.add_subplot(122, projection='3d')
x2 = np.random.rand(100)
y2 = np.random.rand(100)
z2 = np.random.rand(100)
ax2.scatter(x2, y2, z2)

plt.show()
Output:
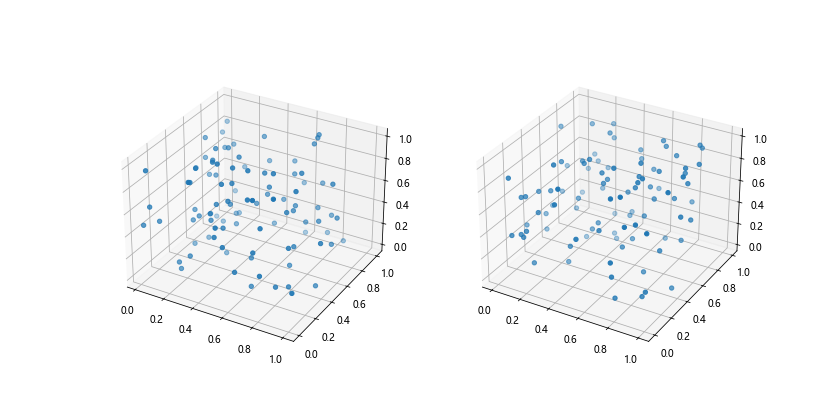
In the above code, we create a figure with two subplots using the add_subplot method. We then generate random data for two scatter plots and plot them in the respective subplots. Running this code will display two 3D scatter plots side by side in the same figure.
6. Customizing 3D Plots
We can customize various aspects of 3D plots, such as adjusting the viewing angle, setting plot limits, and adding labels to axes. Let’s create a 3D scatter plot and customize it.
import numpy as np
import matplotlib.pyplot as plt
from mpl_toolkits.mplot3d import Axes3D

fig = plt.figure()
ax = fig.add_subplot(111, projection='3d')

# Dataset
x = np.random.rand(100)
y = np.random.rand(100)
z = np.random.rand(100)

# Plot
scatter = ax.scatter(x, y, z)

# Customization
ax.view_init(elev=45, azim=30)  # Set the viewing angle
ax.set_xlabel('X Axis')         # Set X-axis label
ax.set_ylabel('Y Axis')         # Set Y-axis label
ax.set_zlabel('Z Axis')         # Set Z-axis label

plt.show()
Output:
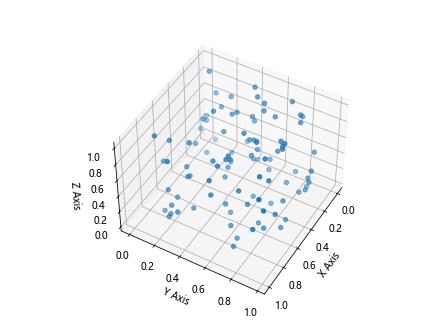
In this code snippet, we create a random 3D scatter plot and then customize it by setting the viewing angle using view_init, adding labels to the axes using set_xlabel, set_ylabel, and set_zlabel. Running this code will display the customized 3D scatter plot.
7. 3D Histogram
A 3D histogram is a type of 3D plot that displays the frequency of data in a three-dimensional space. We can create a 3D histogram using the hist method in Matplotlib.
import numpy as np
import matplotlib.pyplot as plt
from mpl_toolkits.mplot3d import Axes3D

fig = plt.figure()
ax = fig.add_subplot(111, projection='3d')

# Data generation
x = np.random.normal(size=1000)
y = np.random.normal(size=1000)
z = np.random.normal(size=1000)

# Plot
hist, xedges, yedges = np.histogram2d(x, y, bins=10)
xpos, ypos = np.meshgrid(xedges[:-1] + 0.25, yedges[:-1] + 0.25, indexing="ij")
xpos = xpos.ravel()
ypos = ypos.ravel()
zpos = 0

dx = dy = 0.5 * np.ones_like(zpos)
dz = hist.ravel()

ax.bar3d(xpos, ypos, zpos, dx, dy, dz, zsort='average')

plt.show()
Output:
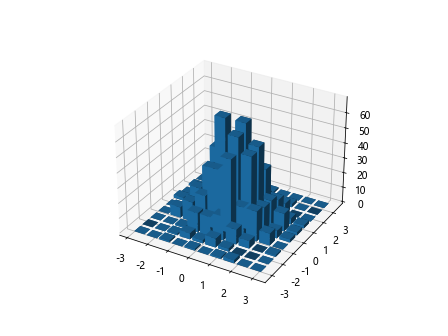
In this code snippet, we generate random data for x, y, and z coordinates. We then create a 3D histogram using the histogram2d function and plot it using the bar3d method to visualize the frequency of data points in a three-dimensional space. Running this code will display a 3D histogram.
8. 3D Pie Chart
A 3D pie chart is a type of 3D plot that represents data in a circular form divided into slices to show numerical proportions. We can create a 3D pie chart using the pie method in Matplotlib.
import matplotlib.pyplot as plt

sizes = [15, 30, 45, 10]
labels = ['A', 'B', 'C', 'D']

fig = plt.figure()
ax = fig.add_subplot(111, projection='3d')

ax.pie(sizes, labels=labels, autopct='%1.1f%%', startangle=140)

plt.show()
In this code snippet, we define the sizes and labels for the slices of the pie chart. We then create a 3D pie chart using the pie method and customize it by including labels with percentages and specifying the start angle. Running this code will display a 3D pie chart.
9. 3D Quiver Plot
A 3D quiver plot is a type of 3D plot that displays vectors as arrows in three-dimensional space. We can create a 3D quiver plot using the quiver method in Matplotlib.
import numpy as np
import matplotlib.pyplot as plt
from mpl_toolkits.mplot3d import Axes3D

fig = plt.figure()
ax = fig.add_subplot(111, projection='3d')

# Data generation
x = np.arange(-5, 5, 1)
y = np.arange(-5, 5, 1)
z = np.arange(-5, 5, 1)
X, Y, Z = np.meshgrid(x, y, z)
U = np.sin(X)
V = np.cos(Y)
W = np.tan(Z)

# Plot
ax.quiver(X, Y, Z, U, V, W)

plt.show()
Output:
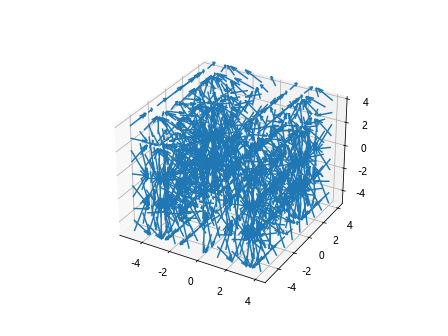
In this code snippet, we create vectors with sine, cosine, and tangent values along the x, y, and z axes. We then plot these vectors as arrows in a 3D space using the quiver method. Running this code will display a 3D quiver plot.
10. 3D Streamplot
A 3D streamplot is a type of 3D plot that represents the flow of a vector field as a collection of streamlines. We can create a 3D streamplot using the streamplot method in Matplotlib.
import numpy as np
import matplotlib.pyplot as plt
from mpl_toolkits.mplot3d import Axes3D

fig = plt.figure()
ax = fig.add_subplot(111, projection='3d')

# Data generation
x = np.linspace(-3, 3, 100)
y = np.linspace(-3, 3, 100)
z = np.linspace(-3, 3, 100)
X, Y, Z = np.meshgrid(x, y, z)
U = -Y
V = X
W = np.zeros_like(X)

# Plot
ax.streamplot(X, Y, Z, U, V, W, color='r')

plt.show()
In this code snippet, we create a vector field with x and y components and plot the streamlines using the streamplot method. Running this code will display a 3D streamplot.
These examples demonstrate the versatility of Matplotlib in creating various types of 3D plots for visualizing data in three dimensions. Experiment with different plot types, customization options, and datasets to gain a deeper understanding of 3D visualization with Matplotlib.