Change Thickness of Line in Matplotlib
Matplotlib is a popular Python library for creating static, animated, and interactive visualizations in Python. In this article, we will focus on how to change the thickness of a line in Matplotlib plots.
1. Basic Line Plot
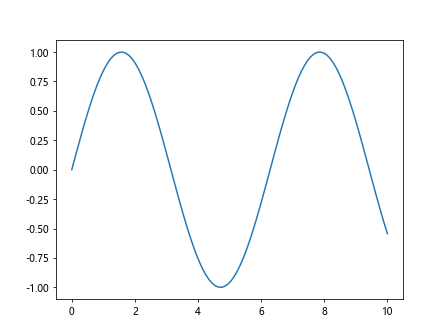
Let’s start by creating a basic line plot using Matplotlib:
import matplotlib.pyplot as plt
import numpy as np

x = np.linspace(0, 10, 100)
y = np.sin(x)

plt.plot(x, y)
plt.show()
Output:
2. Change Line Thickness
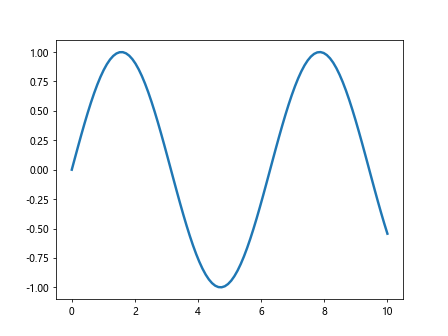
To change the thickness of the line in the plot, you can use the linewidth parameter of the plot() function:
import matplotlib.pyplot as plt
import numpy as np

x = np.linspace(0, 10, 100)
y = np.sin(x)

plt.plot(x, y, linewidth=2.5)
plt.show()
Output:
3. Using Line Width Keyword Argument
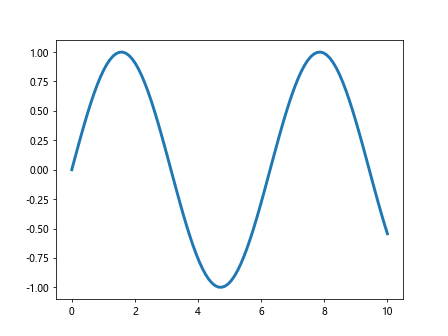
You can also use the lw keyword argument to set the line width:
import matplotlib.pyplot as plt
import numpy as np

x = np.linspace(0, 10, 100)
y = np.sin(x)

plt.plot(x, y, lw=3)
plt.show()
Output:
4. Setting Line Width Using setp()
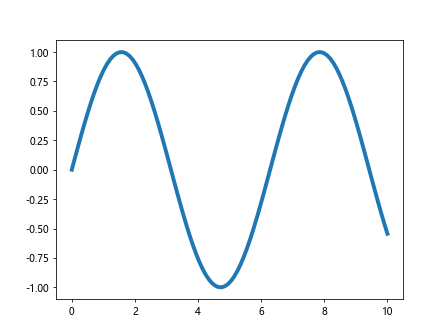
Another way to change the line thickness is by using the setp() function:
import matplotlib.pyplot as plt
import numpy as np

x = np.linspace(0, 10, 100)
y = np.sin(x)

line, = plt.plot(x, y)
plt.setp(line, linewidth=4)
plt.show()
Output:
5. Using Line2D Object
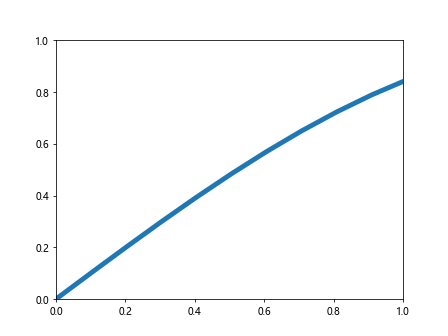
You can also use the Line2D object to set the line width:
from matplotlib.lines import Line2D
import matplotlib.pyplot as plt
import numpy as np

x = np.linspace(0, 10, 100)
y = np.sin(x)

line = Line2D(x, y, linewidth=5)
plt.gca().add_line(line)
plt.show()
Output:
6. Customize Line Width in Legend
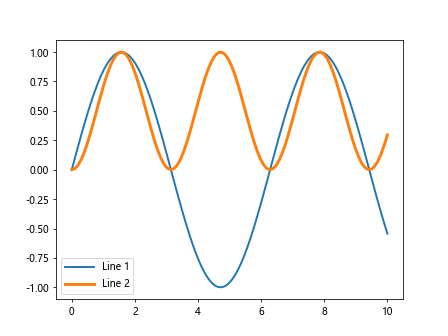
If you have multiple lines in the plot and want to customize the line width in the legend, you can do so using the handlelength parameter:
import matplotlib.pyplot as plt
import numpy as np

x = np.linspace(0, 10, 100)
y = np.sin(x)

plt.plot(x, y, label='Line 1', linewidth=2)
plt.plot(x, y**2, label='Line 2', linewidth=3)
plt.legend(handlelength=3)
plt.show()
Output:
7. Change Line Width for Specific Line
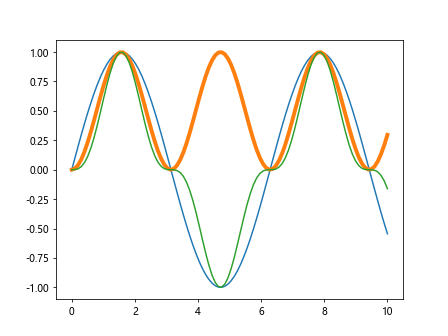
You can also change the line width for a specific line in the plot using its index:
import matplotlib.pyplot as plt
import numpy as np

x = np.linspace(0, 10, 100)
y = np.sin(x)

lines = plt.plot(x, y, x, y**2, x, y**3)
lines[1].set_linewidth(4)
plt.show()
Output:
8. Customizing Line Width Using rcParams
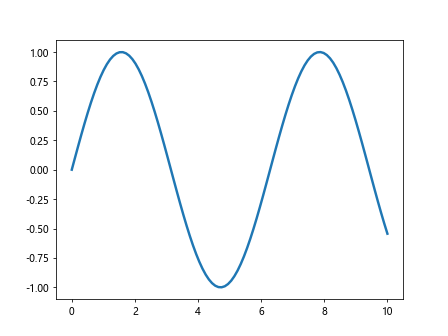
You can set the default line width for all plots in your script using rcParams:
import matplotlib.pyplot as plt
import numpy as np

x = np.linspace(0, 10, 100)
y = np.sin(x)

plt.rcParams['lines.linewidth'] = 2.5
plt.plot(x, y)
plt.show()
Output:
9. Using set() Function
Another way to customize the line width is by using the set() function:
import matplotlib.pyplot as plt
import numpy as np

x = np.linspace(0, 10, 100)
y = np.sin(x)

line = plt.plot(x, y)
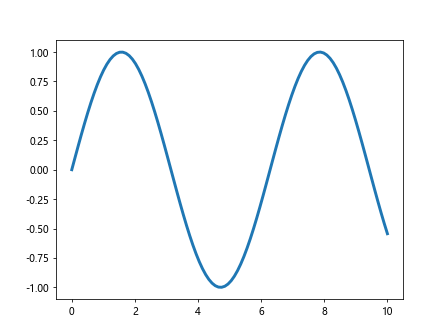
plt.setp(line, linewidth=3)
plt.show()
Output:
10. Change Line Width in Subplots
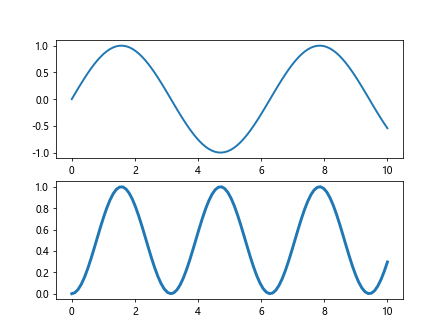
If you are working with subplots, you can set the line width for each subplot individually:
import matplotlib.pyplot as plt
import numpy as np

x = np.linspace(0, 10, 100)
y = np.sin(x)

fig, axs = plt.subplots(2)
axs[0].plot(x, y, linewidth=2)
axs[1].plot(x, y**2, linewidth=3)
plt.show()
Output:
11. Combining Different Line Widths
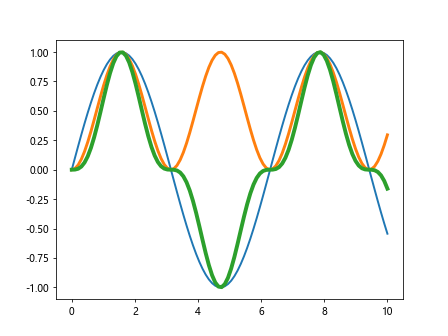
You can combine different line widths in the same plot to highlight various features:
import matplotlib.pyplot as plt
import numpy as np

x = np.linspace(0, 10, 100)
y = np.sin(x)

plt.plot(x, y, linewidth=2)
plt.plot(x, y**2, linewidth=3)
plt.plot(x, y**3, linewidth=4)
plt.show()
Output:
12. Using Different Line Styles
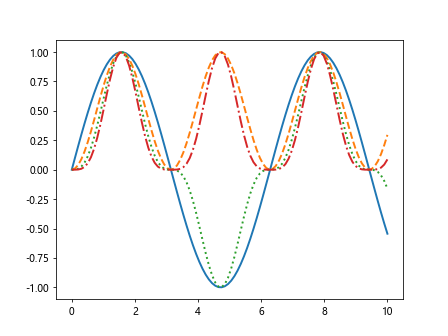
In addition to changing line thickness, you can also experiment with different line styles for better visualization:
import matplotlib.pyplot as plt
import numpy as np

x = np.linspace(0, 10, 100)
y = np.sin(x)

plt.plot(x, y, linestyle='-', linewidth=2)
plt.plot(x, y**2, linestyle='--', linewidth=2)
plt.plot(x, y**3, linestyle=':', linewidth=2)
plt.plot(x, y**4, linestyle='-.', linewidth=2)
plt.show()
Output:
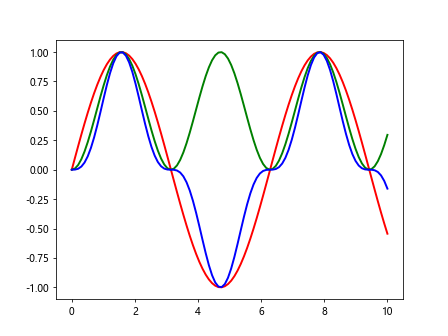
13. Changing Line Color
You can further enhance your plots by changing the line colors along with the thickness:
import matplotlib.pyplot as plt
import numpy as np

x = np.linspace(0, 10, 100)
y = np.sin(x)

plt.plot(x, y, color='red', linewidth=2)
plt.plot(x, y**2, color='green', linewidth=2)
plt.plot(x, y**3, color='blue', linewidth=2)
plt.show()
Output:
14. Summary
In this article, we have explored various ways to change the thickness of lines in Matplotlib plots. By adjusting the line width, you can create visually appealing and informative visualizations for your data analysis and presentation needs.
Remember to experiment with different line widths, styles, and colors to find the combination that best suits your data and storytelling objectives. Matplotlib offers a wide range of customization options to help you create professional-looking plots with ease.