Axes Set Title in Matplotlib
Matplotlib is a powerful plotting library used for creating static, interactive, and animated visualizations in Python. One of the fundamental aspects of creating visualizations is the ability to add titles to your plots. Titles provide a context and describe what the plot represents. In this article, we will explore various ways to set titles on axes in Matplotlib, including customization options for font size, style, and position.
Basic Title Setting
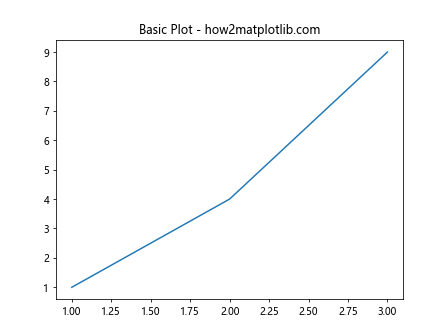
To set a title for an axes object in Matplotlib, you can use the set_title method. Here is a simple example:
import matplotlib.pyplot as plt

fig, ax = plt.subplots()
ax.plot([1, 2, 3], [1, 4, 9])
ax.set_title("Basic Plot - how2matplotlib.com")
plt.show()
Output:
Customizing the Title Font
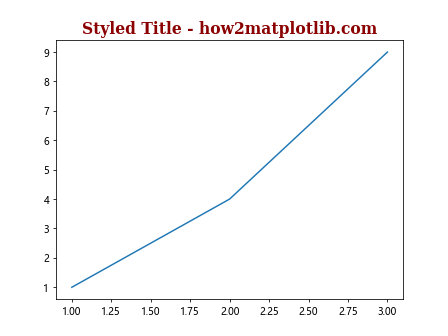
You can customize the appearance of the title by specifying font properties such as the font size, weight, and family. Here’s how you can change these properties:
import matplotlib.pyplot as plt

fig, ax = plt.subplots()
ax.plot([1, 2, 3], [1, 4, 9])
title_properties = {
    'family': 'serif',
    'color':  'darkred',
    'weight': 'bold',
    'size': 16,
}
ax.set_title("Styled Title - how2matplotlib.com", fontdict=title_properties)
plt.show()
Output:
Positioning the Title
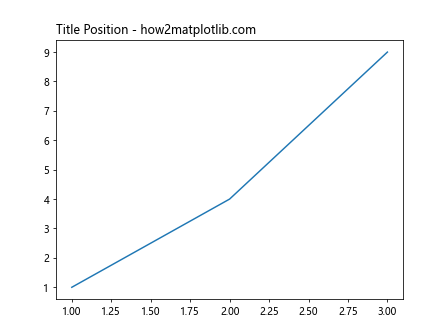
The title’s position can be adjusted relative to the axes. This is useful when you need to place the title in a specific location for layout or aesthetic purposes.
import matplotlib.pyplot as plt

fig, ax = plt.subplots()
ax.plot([1, 2, 3], [1, 4, 9])
ax.set_title("Title Position - how2matplotlib.com", loc='left')
plt.show()
Output:
Adding Subtitles
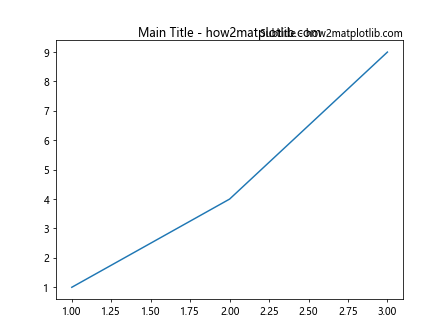
Sometimes, you might want to add a subtitle below the main title. This can be achieved by using the title method with the pad parameter.
import matplotlib.pyplot as plt

fig, ax = plt.subplots()
ax.plot([1, 2, 3], [1, 4, 9])
ax.set_title("Main Title - how2matplotlib.com", pad=20)
ax.set_title("Subtitle - how2matplotlib.com", pad=-25, fontsize=10, loc='right')
plt.show()
Output:
Using LaTeX in Titles
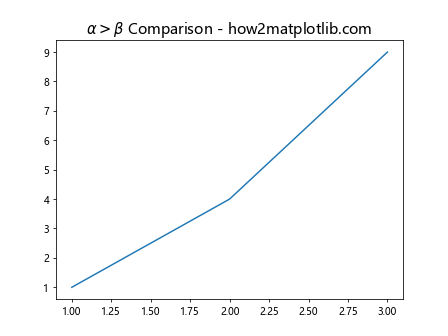
For scientific plots, it might be necessary to include mathematical expressions in titles. Matplotlib supports LaTeX formatting.
import matplotlib.pyplot as plt

fig, ax = plt.subplots()
ax.plot([1, 2, 3], [1, 4, 9])
ax.set_title(r"$\alpha > \beta$ Comparison - how2matplotlib.com", fontsize=15)
plt.show()
Output:
Multi-line Titles
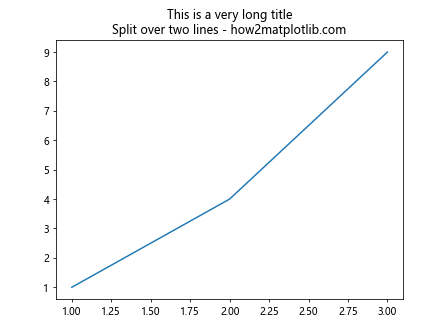
If the title is long, you might want to split it into multiple lines. This can be done by inserting newline characters (\n) in the title string.
import matplotlib.pyplot as plt

fig, ax = plt.subplots()
ax.plot([1, 2, 3], [1, 4, 9])
ax.set_title("This is a very long title\nSplit over two lines - how2matplotlib.com")
plt.show()
Output:
Rotating Titles
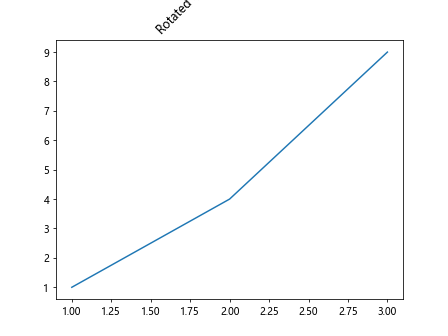
In some cases, especially in subplots, you might want to rotate the title to fit better or for stylistic reasons.
import matplotlib.pyplot as plt

fig, ax = plt.subplots()
ax.plot([1, 2, 3], [1, 4, 9])
ax.set_title("Rotated Title - how2matplotlib.com", rotation=45)
plt.show()
Output:
Adjusting Title Margins
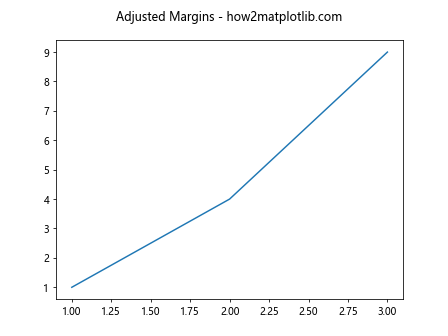
Adjusting the margins around the title can help in fine-tuning its position, especially when using subplots or when the default spacing is not suitable.
import matplotlib.pyplot as plt

fig, ax = plt.subplots()
ax.plot([1, 2, 3], [1, 4, 9])
ax.set_title("Adjusted Margins - how2matplotlib.com", pad=20)
plt.show()
Output:
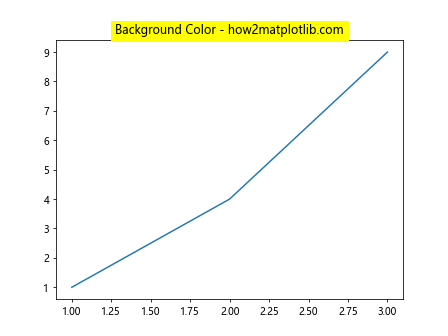
Title with Background Color
Setting a background color for the title can make it stand out more, especially if the plot has a lot of elements.
import matplotlib.pyplot as plt

fig, ax = plt.subplots()
ax.plot([1, 2, 3], [1, 4, 9])
ax.set_title("Background Color - how2matplotlib.com", backgroundcolor='yellow')
plt.show()
Output:
Conclusion
Setting titles in Matplotlib is straightforward but offers a lot of flexibility. By customizing the font, position, and style of the title, you can enhance the readability and appearance of your plots. Whether you are preparing plots for a presentation, a scientific paper, or just exploring data, understanding how to effectively use titles in Matplotlib is an essential skill.