Annotation Box in Matplotlib
Annotation box is a feature in Matplotlib that allows you to add annotations to your plots with a box around them for emphasis. In this article, we will explore how to use annotation box in Matplotlib using various examples.
Basic Annotation Box
Let’s start with a basic example of adding an annotation box to a plot.
import matplotlib.pyplot as plt

fig, ax = plt.subplots()
ax.plot([1, 2, 3, 4], [1, 4, 9, 16])

ax.annotate('This point', (3, 9), xytext=(4, 10),
             arrowprops=dict(facecolor='black', shrink=0.05))

plt.show()
Output:
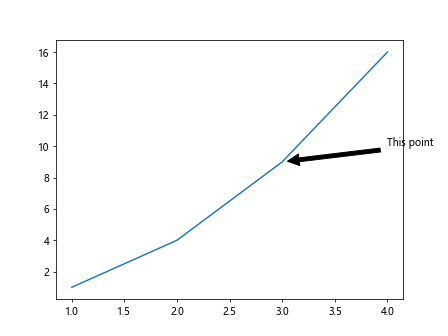
In this example, we have a simple line plot with an annotation box added at the point (3, 9) with the text “This point”.
Customizing Annotation Box
You can customize the appearance of the annotation box by changing various properties such as text color, box color, arrow style, etc. Here’s an example:
import matplotlib.pyplot as plt

fig, ax = plt.subplots()
ax.plot([1, 2, 3, 4], [1, 4, 9, 16])

bbox_props = dict(boxstyle="round,pad=0.3", fc="cyan", ec="b", lw=2)
arrow_props = dict(arrowstyle="->")

ax.annotate('How2matplotlib.com', (2, 4), xytext=(3, 6),
             bbox=bbox_props, arrowprops=arrow_props, fontsize=12, color='red')

plt.show()
Output:
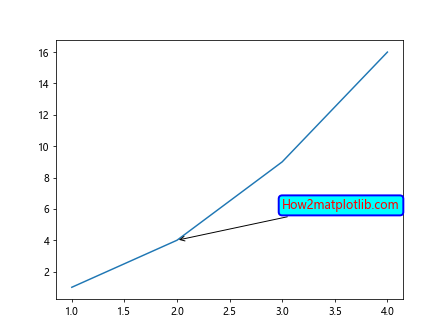
In this example, we have customized the appearance of the annotation box by changing the box style to “round”, box color to cyan, edge color to blue, arrow style to “->”, text color to red, and font size to 12.
Multiple Annotation Boxes
You can add multiple annotation boxes to a plot at different positions. Here’s an example with two annotation boxes:
import matplotlib.pyplot as plt

fig, ax = plt.subplots()
ax.plot([1, 2, 3, 4], [1, 4, 9, 16])

ax.annotate('How2matplotlib.com', (3, 9), xytext=(4, 12),
             arrowprops=dict(facecolor='black', shrink=0.05))

ax.annotate('Another point', (1, 1), xytext=(0.5, 2),
             arrowprops=dict(facecolor='green', shrink=0.05))

plt.show()
Output:
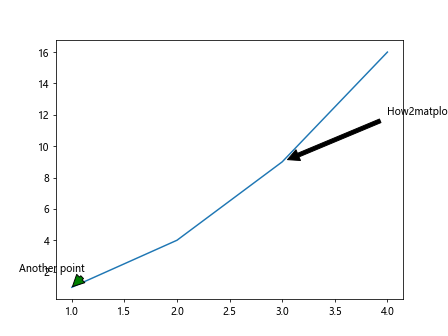
In this example, we have added two annotation boxes to the plot at points (3, 9) and (1, 1).
Annotation Box with ConnectionPatch
You can also use ConnectionPatch to connect the annotation box to a specific point on the plot. Here’s an example:
import matplotlib.pyplot as plt
from matplotlib.patches import ConnectionPatch

fig, ax = plt.subplots()
ax.plot([1, 2, 3, 4], [1, 4, 9, 16])

xy = (3, 9)
con = ConnectionPatch(xyA=xy, xyB=xy, coordsA="data", coordsB="data",
                      axesA=ax, axesB=ax, color="cyan", lw=2)

ax.add_artist(con)

plt.annotate('How2matplotlib.com', (3, 9), xytext=(4, 10),
             arrowprops=dict(facecolor='black', shrink=0.05))

plt.show()
Output:
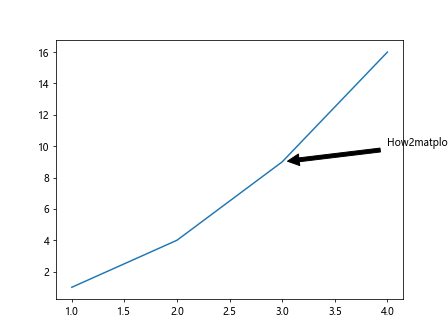
In this example, we have used ConnectionPatch to connect the annotation box to the point (3, 9).
Adding Annotation Box to Specific Axes
You can add annotation boxes to specific axes in a plot with multiple subplots. Here’s an example:
import matplotlib.pyplot as plt

fig, (ax1, ax2) = plt.subplots(1, 2)
ax1.plot([1, 2, 3, 4], [1, 4, 9, 16])
ax2.plot([1, 2, 3, 4], [16, 9, 4, 1])

ax1.annotate('How2matplotlib.com', (3, 9), xytext=(4, 10),
              arrowprops=dict(facecolor='black', shrink=0.05))

ax2.annotate('Another point', (1, 16), xytext=(1.5, 14),
              arrowprops=dict(facecolor='green', shrink=0.05))

plt.show()
Output:
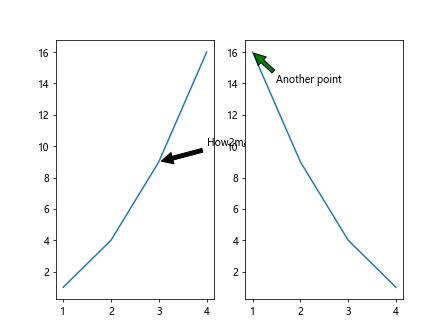
In this example, we have added annotation boxes to specific axes ax1 and ax2 in a plot with two subplots.
Annotation Box with Background Color
You can highlight the annotation box by adding a background color to it. Here’s an example:
import matplotlib.pyplot as plt

fig, ax = plt.subplots()
ax.plot([1, 2, 3, 4], [1, 4, 9, 16])

bbox_props = dict(boxstyle="round,pad=0.3", fc="yellow", ec="black", lw=2)
arrow_props = dict(arrowstyle="->")

ax.annotate('How2matplotlib.com', (2, 4), xytext=(3, 6),
             bbox=bbox_props, arrowprops=arrow_props)

plt.show()
Output:
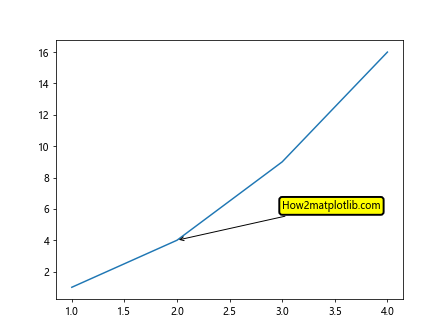
In this example, we have added a yellow background color to the annotation box.
Annotation Box with Shadow
You can add a shadow effect to the annotation box to make it stand out more. Here’s an example:
import matplotlib.pyplot as plt

fig, ax = plt.subplots()
ax.plot([1, 2, 3, 4], [1, 4, 9, 16])

bbox_props = dict(boxstyle="round,pad=0.3", fc="cyan", ec="b", lw=2, shadow=True)
arrow_props = dict(arrowstyle="->")

ax.annotate('How2matplotlib.com', (2, 4), xytext=(3, 6),
             bbox=bbox_props, arrowprops=arrow_props)

plt.show()
In this example, we have added a shadow effect to the annotation box.
Annotation Box with Text Rotation
You can rotate the text in the annotation box by setting the rotation property. Here’s an example:
import matplotlib.pyplot as plt

fig, ax = plt.subplots()
ax.plot([1, 2, 3, 4], [1, 4, 9, 16])

bbox_props = dict(boxstyle="round,pad=0.3", fc="cyan", ec="b", lw=2)
arrow_props = dict(arrowstyle="->")

ax.annotate('How2matplotlib.com', (2, 4), xytext=(3, 6),
             bbox=bbox_props, arrowprops=arrow_props, rotation=45)

plt.show()
Output:
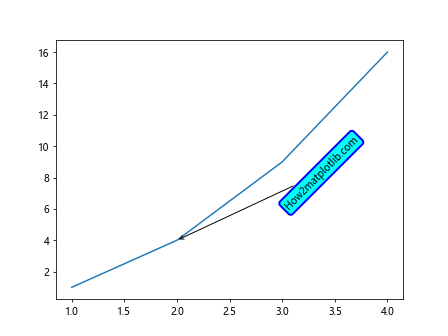
In this example, we have rotated the text in the annotation box by 45 degrees.
Annotation Box with Text Alignment
You can align the text in the annotation box to the left, right, or center. Here’s an example of right-aligned text:
import matplotlib.pyplot as plt

fig, ax = plt.subplots()
ax.plot([1, 2, 3, 4], [1, 4, 9, 16])

bbox_props = dict(boxstyle="round,pad=0.3", fc="cyan", ec="b", lw=2)
arrow_props = dict(arrowstyle="->")

ax.annotate('How2matplotlib.com', (2, 4), xytext=(3, 6),
             bbox=bbox_props, arrowprops=arrow_props, ha='right')

plt.show()
Output:
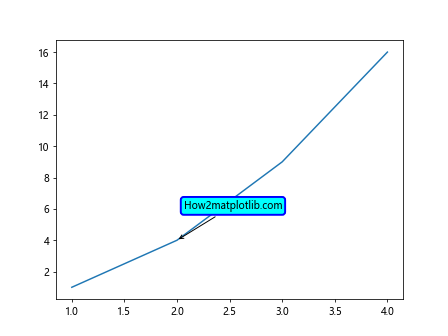
In this example, we have right-aligned the text in the annotation box.
Annotation Box with Text Font
You can change the font of the text in the annotation box by setting the font properties. Here’s an example:
import matplotlib.pyplot as plt
from matplotlib.font_manager import FontProperties

fig, ax = plt.subplots()
ax.plot([1, 2, 3, 4], [1, 4, 9, 16])

font = FontProperties()
font.set_family('serif')
font.set_style('italic')

bbox_props = dict(boxstyle="round,pad=0.3", fc="cyan", ec="b", lw=2)
arrow_props = dict(arrowstyle="->")

ax.annotate('How2matplotlib.com', (2, 4), xytext=(3, 6),
             bbox=bbox_props, arrowprops=arrow_props, fontproperties=font)

plt.show()
Output:
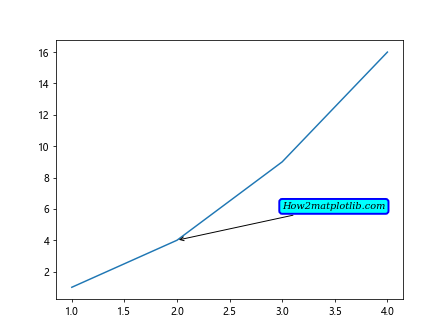
In this example, we have changed the font of the text in the annotation box to a serif italic style.
Annotation Box with Text Background
You can add a background color to the text in the annotation box to highlight it. Here’s an example:
import matplotlib.pyplot as plt

fig, ax = plt.subplots()
ax.plot([1, 2, 3, 4], [1, 4, 9, 16])

bbox_props = dict(boxstyle="round,pad=0.3", fc="cyan", ec="b", lw=2)
arrow_props = dict(arrowstyle="->")

ax.annotate('How2matplotlib.com', (2, 4), xytext=(3, 6),
             bbox=bbox_props, arrowprops=arrow_props, textcoords='axes fraction',
             fontsize=12, family='monospace', backgroundcolor='lightyellow')

plt.show()
Output:
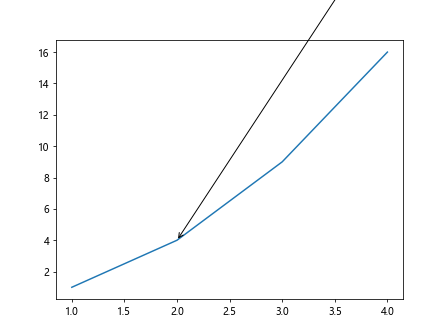
In this example, we have added a light yellow background color to the text in the annotation box.
Annotation Box in Matplotlib Conclusion
In this article, we have covered various examples of using annotation box in Matplotlib to add annotations to plots with customizable properties such as text color, box color, text alignment, text rotation, font style, shadow effect, and background color. By using annotation boxes effectively, you can enhance the visual appeal of your plots and communicate additional information to your audience.
Remember to experiment with different properties and styles to find the best way to convey your message using annotation boxes in Matplotlib.