How to Add a Vertical Slider with Matplotlib
Add a vertical slider with matplotlib to enhance your data visualization experience. Matplotlib is a powerful plotting library in Python, and adding interactive elements like vertical sliders can greatly improve the user’s ability to explore and analyze data. In this comprehensive guide, we’ll explore various ways to add a vertical slider with matplotlib, providing detailed explanations and examples along the way.
Understanding Vertical Sliders in Matplotlib
Before we dive into the specifics of how to add a vertical slider with matplotlib, let’s first understand what vertical sliders are and why they’re useful. A vertical slider is an interactive widget that allows users to adjust a value by moving a handle up or down along a vertical axis. When integrated with matplotlib plots, vertical sliders can be used to dynamically update plot parameters, filter data, or control other aspects of the visualization.
To add a vertical slider with matplotlib, we typically use the Slider widget from matplotlib’s widgets module. This widget can be customized to fit various needs and can be connected to plot update functions to create interactive visualizations.
Setting Up Your Environment to Add a Vertical Slider with Matplotlib
To get started with adding a vertical slider with matplotlib, you’ll need to ensure you have the necessary libraries installed. Here’s a simple example of how to import the required modules:
import matplotlib.pyplot as plt
from matplotlib.widgets import Slider
import numpy as np

# Your plot code will go here
plt.figure(figsize=(8, 6))
plt.title("How to Add a Vertical Slider with Matplotlib - how2matplotlib.com")
plt.show()
Output:
This code sets up the basic environment for creating a plot with matplotlib and importing the Slider widget. The numpy library is also imported as it’s commonly used for data manipulation in matplotlib plots.
Basic Implementation: Adding a Vertical Slider with Matplotlib
Let’s start with a basic example of how to add a vertical slider with matplotlib. We’ll create a simple sine wave plot and use a vertical slider to control its frequency.
import matplotlib.pyplot as plt
from matplotlib.widgets import Slider
import numpy as np

# Create the initial plot
fig, ax = plt.subplots(figsize=(8, 6))
plt.subplots_adjust(left=0.25, bottom=0.25)

t = np.arange(0.0, 1.0, 0.001)
initial_frequency = 3.0
s = np.sin(2 * np.pi * initial_frequency * t)
l, = plt.plot(t, s, lw=2)

# Add the vertical slider
slider_ax = plt.axes([0.05, 0.25, 0.0225, 0.63])
freq_slider = Slider(
    ax=slider_ax,
    label='Frequency',
    valmin=0.1,
    valmax=10.0,
    valinit=initial_frequency,
    orientation='vertical'
)

# Define the update function
def update(val):
    freq = freq_slider.val
    l.set_ydata(np.sin(2 * np.pi * freq * t))
    fig.canvas.draw_idle()

# Connect the slider to the update function
freq_slider.on_changed(update)

plt.title("How to Add a Vertical Slider with Matplotlib - how2matplotlib.com")
plt.show()
Output:
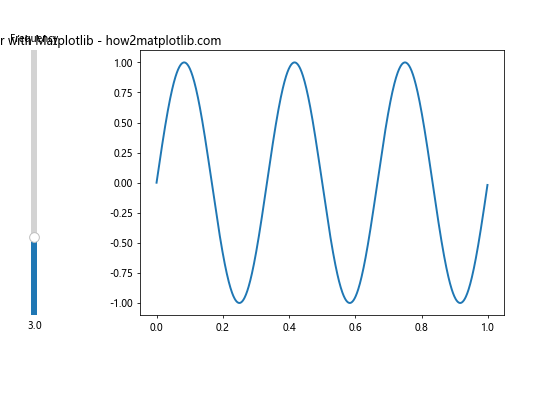
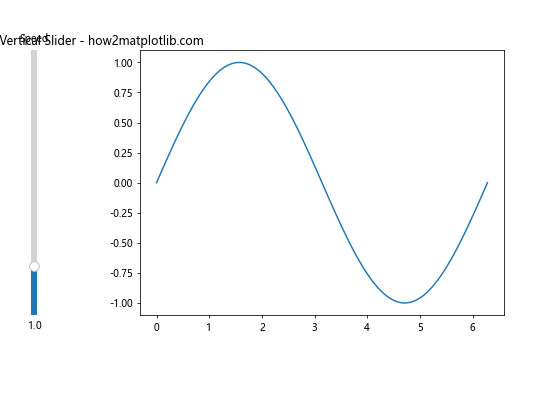
In this example, we create a plot of a sine wave and add a vertical slider with matplotlib to control its frequency. The slider is positioned on the left side of the plot, and when adjusted, it updates the sine wave in real-time.
Customizing the Appearance of Your Vertical Slider
When you add a vertical slider with matplotlib, you have various options to customize its appearance. Let’s explore some of these options:
import matplotlib.pyplot as plt
from matplotlib.widgets import Slider
import numpy as np

fig, ax = plt.subplots(figsize=(8, 6))
plt.subplots_adjust(left=0.25, bottom=0.25)

t = np.arange(0.0, 1.0, 0.001)
initial_amplitude = 1.0
s = initial_amplitude * np.sin(2 * np.pi * 3 * t)
l, = plt.plot(t, s, lw=2)

slider_ax = plt.axes([0.05, 0.25, 0.0225, 0.63])
amp_slider = Slider(
    ax=slider_ax,
    label='Amplitude',
    valmin=0,
    valmax=2,
    valinit=initial_amplitude,
    orientation='vertical',
    color='red',
    track_color='lightgray',
    handle_style={'facecolor': 'blue', 'edgecolor': 'green', 'size': 16}
)

def update(val):
    amp = amp_slider.val
    l.set_ydata(amp * np.sin(2 * np.pi * 3 * t))
    fig.canvas.draw_idle()

amp_slider.on_changed(update)

plt.title("Customized Vertical Slider - how2matplotlib.com")
plt.show()
Output:
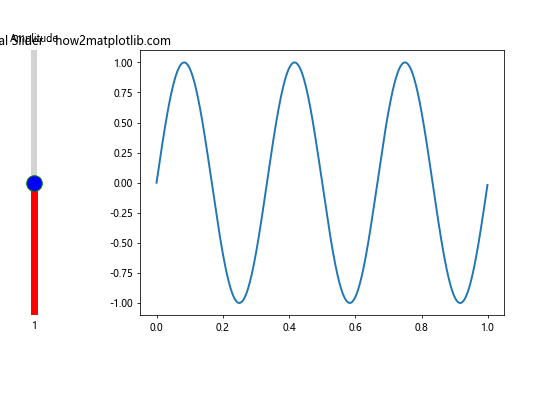
In this example, we’ve customized the appearance of the vertical slider by changing its color, track color, and handle style. These customizations can help the slider better integrate with your plot’s overall design.
Using Multiple Vertical Sliders
Often, you might want to add multiple vertical sliders with matplotlib to control different aspects of your plot. Here’s an example of how to implement this:
import matplotlib.pyplot as plt
from matplotlib.widgets import Slider
import numpy as np

fig, ax = plt.subplots(figsize=(10, 6))
plt.subplots_adjust(left=0.35, bottom=0.25)

t = np.arange(0.0, 1.0, 0.001)
initial_amplitude = 1.0
initial_frequency = 3.0
s = initial_amplitude * np.sin(2 * np.pi * initial_frequency * t)
l, = plt.plot(t, s, lw=2)

amp_slider_ax = plt.axes([0.05, 0.25, 0.0225, 0.63])
freq_slider_ax = plt.axes([0.15, 0.25, 0.0225, 0.63])

amp_slider = Slider(
    ax=amp_slider_ax,
    label='Amplitude',
    valmin=0,
    valmax=2,
    valinit=initial_amplitude,
    orientation='vertical'
)

freq_slider = Slider(
    ax=freq_slider_ax,
    label='Frequency',
    valmin=0.1,
    valmax=10.0,
    valinit=initial_frequency,
    orientation='vertical'
)

def update(val):
    amp = amp_slider.val
    freq = freq_slider.val
    l.set_ydata(amp * np.sin(2 * np.pi * freq * t))
    fig.canvas.draw_idle()

amp_slider.on_changed(update)
freq_slider.on_changed(update)

plt.title("Multiple Vertical Sliders - how2matplotlib.com")
plt.show()
Output:
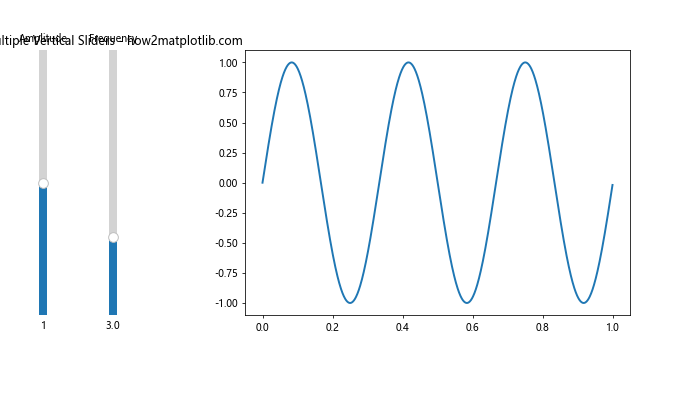
This example demonstrates how to add a vertical slider with matplotlib for both amplitude and frequency control of a sine wave. The sliders are positioned side by side on the left of the plot.
Combining Vertical and Horizontal Sliders
While our focus is on how to add a vertical slider with matplotlib, it’s worth noting that you can combine vertical and horizontal sliders for even more interactive control. Here’s an example:
import matplotlib.pyplot as plt
from matplotlib.widgets import Slider
import numpy as np

fig, ax = plt.subplots(figsize=(10, 6))
plt.subplots_adjust(left=0.25, bottom=0.25)

t = np.arange(0.0, 1.0, 0.001)
initial_amplitude = 1.0
initial_frequency = 3.0
initial_phase = 0.0
s = initial_amplitude * np.sin(2 * np.pi * initial_frequency * t + initial_phase)
l, = plt.plot(t, s, lw=2)

amp_slider_ax = plt.axes([0.05, 0.25, 0.0225, 0.63])
freq_slider_ax = plt.axes([0.1, 0.25, 0.0225, 0.63])
phase_slider_ax = plt.axes([0.25, 0.1, 0.65, 0.03])

amp_slider = Slider(
    ax=amp_slider_ax,
    label='Amplitude',
    valmin=0,
    valmax=2,
    valinit=initial_amplitude,
    orientation='vertical'
)

freq_slider = Slider(
    ax=freq_slider_ax,
    label='Frequency',
    valmin=0.1,
    valmax=10.0,
    valinit=initial_frequency,
    orientation='vertical'
)

phase_slider = Slider(
    ax=phase_slider_ax,
    label='Phase',
    valmin=0,
    valmax=2*np.pi,
    valinit=initial_phase
)

def update(val):
    amp = amp_slider.val
    freq = freq_slider.val
    phase = phase_slider.val
    l.set_ydata(amp * np.sin(2 * np.pi * freq * t + phase))
    fig.canvas.draw_idle()

amp_slider.on_changed(update)
freq_slider.on_changed(update)
phase_slider.on_changed(update)

plt.title("Vertical and Horizontal Sliders - how2matplotlib.com")
plt.show()
Output:
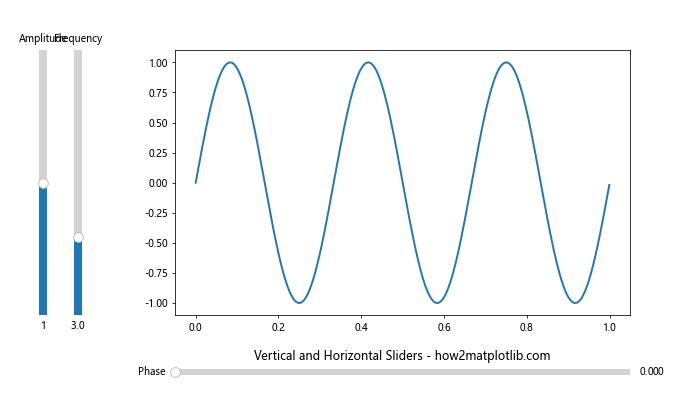
This example shows how to add a vertical slider with matplotlib for amplitude and frequency, while using a horizontal slider for phase control. This combination provides a comprehensive set of controls for the sine wave plot.
Adding Labels and Annotations to Vertical Sliders
When you add a vertical slider with matplotlib, it’s often helpful to include additional labels or annotations to provide context or display current values. Here’s an example of how to do this:
import matplotlib.pyplot as plt
from matplotlib.widgets import Slider
import numpy as np

fig, ax = plt.subplots(figsize=(8, 6))
plt.subplots_adjust(left=0.35, bottom=0.25)

t = np.arange(0.0, 1.0, 0.001)
initial_amplitude = 1.0
s = initial_amplitude * np.sin(2 * np.pi * 3 * t)
l, = plt.plot(t, s, lw=2)

slider_ax = plt.axes([0.05, 0.25, 0.0225, 0.63])
amp_slider = Slider(
    ax=slider_ax,
    label='Amplitude',
    valmin=0,
    valmax=2,
    valinit=initial_amplitude,
    orientation='vertical'
)

value_text = plt.text(0.05, 0.9, f"Value: {initial_amplitude:.2f}", transform=fig.transFigure)

def update(val):
    amp = amp_slider.val
    l.set_ydata(amp * np.sin(2 * np.pi * 3 * t))
    value_text.set_text(f"Value: {amp:.2f}")
    fig.canvas.draw_idle()

amp_slider.on_changed(update)

plt.title("Vertical Slider with Annotation - how2matplotlib.com")
plt.show()
Output:
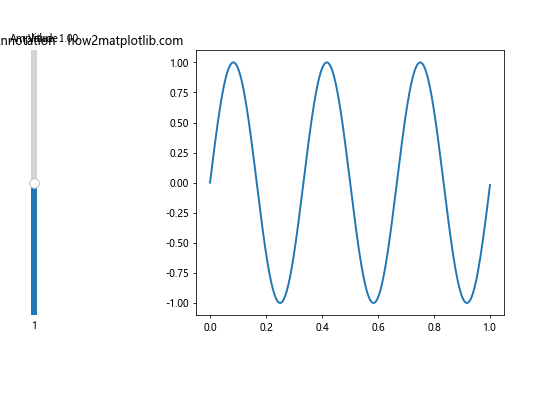
In this example, we’ve added a text annotation that displays the current value of the slider. This text updates in real-time as the slider is adjusted, providing immediate feedback to the user.
Using Vertical Sliders for Data Filtering
Another common use case when you add a vertical slider with matplotlib is for data filtering. Let’s look at an example where a vertical slider is used to filter data points in a scatter plot:
import matplotlib.pyplot as plt
from matplotlib.widgets import Slider
import numpy as np

# Generate random data
np.random.seed(42)
x = np.random.rand(100)
y = np.random.rand(100)
sizes = np.random.rand(100) * 100

fig, ax = plt.subplots(figsize=(8, 6))
plt.subplots_adjust(left=0.25, bottom=0.25)

scatter = ax.scatter(x, y, s=sizes)
ax.set_xlim(0, 1)
ax.set_ylim(0, 1)

slider_ax = plt.axes([0.05, 0.25, 0.0225, 0.63])
size_slider = Slider(
    ax=slider_ax,
    label='Min Size',
    valmin=0,
    valmax=100,
    valinit=0,
    orientation='vertical'
)

def update(val):
    min_size = size_slider.val
    sizes_filtered = np.where(sizes < min_size, 0, sizes)
    scatter.set_sizes(sizes_filtered)
    fig.canvas.draw_idle()

size_slider.on_changed(update)

plt.title("Data Filtering with Vertical Slider - how2matplotlib.com")
plt.show()
Output:
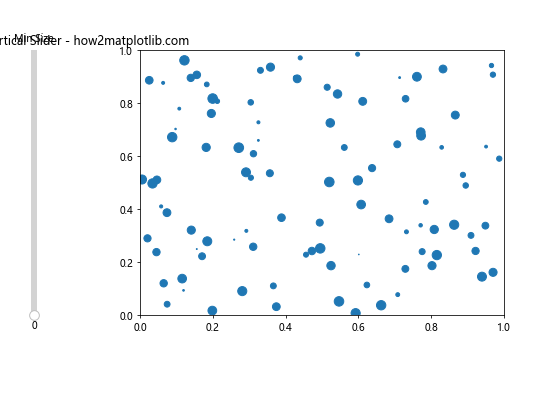
In this example, we use a vertical slider to filter out data points in a scatter plot based on their size. As the slider is adjusted, points smaller than the selected size disappear from the plot.
Vertical Sliders for Color Mapping
When you add a vertical slider with matplotlib, you can also use it to control color mapping in your plots. Here's an example that demonstrates this:
import matplotlib.pyplot as plt
from matplotlib.widgets import Slider
import numpy as np

# Generate sample data
x = np.linspace(0, 10, 100)
y = np.linspace(0, 10, 100)
X, Y = np.meshgrid(x, y)
Z = np.sin(X) * np.cos(Y)

fig, ax = plt.subplots(figsize=(8, 6))
plt.subplots_adjust(left=0.25, bottom=0.25)

im = ax.imshow(Z, cmap='viridis', aspect='auto')
plt.colorbar(im)

slider_ax = plt.axes([0.05, 0.25, 0.0225, 0.63])
vmin_slider = Slider(
    ax=slider_ax,
    label='Color Min',
    valmin=-1,
    valmax=1,
    valinit=-1,
    orientation='vertical'
)

def update(val):
    vmin = vmin_slider.val
    im.set_clim(vmin=vmin)
    fig.canvas.draw_idle()

vmin_slider.on_changed(update)

plt.title("Color Mapping with Vertical Slider - how2matplotlib.com")
plt.show()
Output:
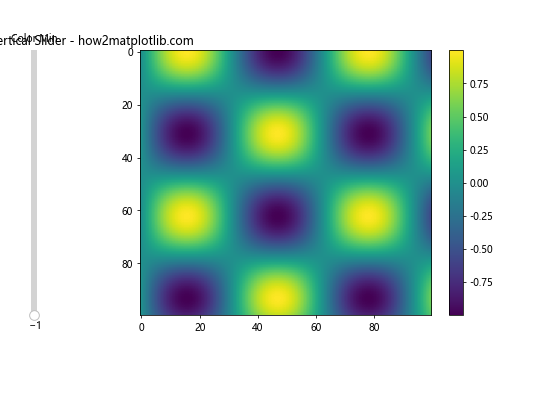
This example uses a vertical slider to control the minimum value of the color scale in a 2D plot. As the slider is adjusted, the color mapping of the plot changes accordingly.
Vertical Sliders for Animation Control
You can also add a vertical slider with matplotlib to control animations. Here's an example that uses a vertical slider to control the speed of a simple animation:
import matplotlib.pyplot as plt
from matplotlib.widgets import Slider
import numpy as np
from matplotlib.animation import FuncAnimation

fig, ax = plt.subplots(figsize=(8, 6))
plt.subplots_adjust(left=0.25, bottom=0.25)

x = np.linspace(0, 2*np.pi, 100)
line, = ax.plot(x, np.sin(x))

slider_ax = plt.axes([0.05, 0.25, 0.0225, 0.63])
speed_slider = Slider(
    ax=slider_ax,
    label='Speed',
    valmin=0.1,
    valmax=5,
    valinit=1,
    orientation='vertical'
)

def animate(frame):
    line.set_ydata(np.sin(x + frame * speed_slider.val))
    return line,

ani = FuncAnimation(fig, animate, frames=200, interval=50, blit=True)

plt.title("Animation Control with Vertical Slider - how2matplotlib.com")
plt.show()
Output:
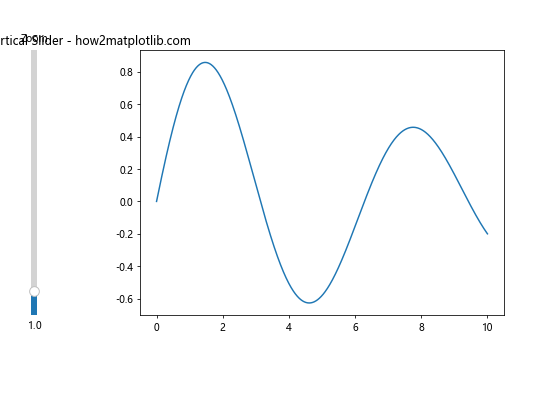
In this example, we use a vertical slider to control the speed of a sine wave animation. The slider adjusts the phase shift applied in each frame, effectively changing the animation speed.
Vertical Sliders for Zoom Control
Another useful application when you add a vertical slider with matplotlib is to control the zoom level of a plot. Here's an example:
import matplotlib.pyplot as plt
from matplotlib.widgets import Slider
import numpy as np

fig, ax = plt.subplots(figsize=(8, 6))
plt.subplots_adjust(left=0.25, bottom=0.25)

x = np.linspace(0, 10, 1000)
y = np.sin(x) * np.exp(-x/10)
line, = ax.plot(x, y)

slider_ax = plt.axes([0.05, 0.25, 0.0225, 0.63])
zoom_slider = Slider(
    ax=slider_ax,
    label='Zoom',
    valmin=0.1,
    valmax=10,
    valinit=1,
    orientation='vertical'
)

def update(val):
    zoom = zoom_slider.val
    ax.set_xlim(5 - 5/zoom, 5 + 5/zoom)
    ax.set_ylim(y.min()/zoom, y.max()/zoom)
    fig.canvas.draw_idle()

zoom_slider.on_changed(update)

plt.title("Zoom Control with Vertical Slider - how2matplotlib.com")
plt.show()
Output:
This example demonstrates how to use a vertical slider to control the zoom level of a plot. As the slider is adjusted, the visible range of both x and y axes changes, effectively zooming in or out of the plot.
Vertical Sliders for Histogram Bin Control
When working with histograms, you can add a vertical slider with matplotlib to dynamically control the number of bins. Here's an example:
import matplotlib.pyplot as plt
from matplotlib.widgets import Slider
import numpy as np

fig, ax = plt.subplots(figsize=(8, 6))
plt.subplots_adjust(left=0.25, bottom=0.25)

data = np.random.randn(1000)
n, bins, patches = ax.hist(data, bins=30)

slider_ax = plt.axes([0.05, 0.25, 0.0225, 0.63])
bins_slider = Slider(
    ax=slider_ax,
    label='Bins',
    valmin=5,
    valmax=100,
    valinit=30,
    orientation='vertical',
    valstep=1
)

def update(val):
    ax.clear()
    ax.hist(data, bins=int(bins_slider.val))
    fig.canvas.draw_idle()

bins_slider.on_changed(update)

plt.title("Histogram Bin Control with Vertical Slider - how2matplotlib.com")
plt.show()
Output:
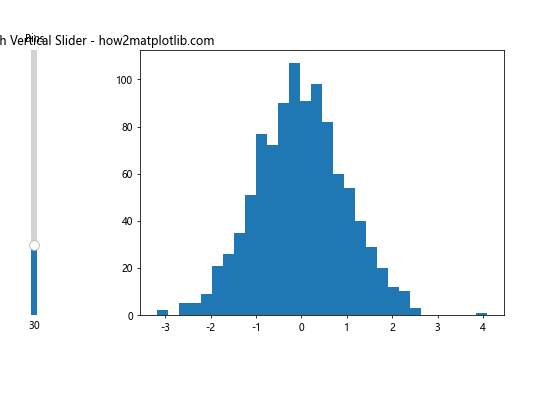
In this example, we use a vertical slider to control the number of bins in a histogram. As the slider is adjusted, the histogram is redrawn with the new number of bins.
Vertical Sliders for Contour Plot Level Control
When working with contour plots, you can add a vertical slider with matplotlib to control the number of contour levels. Here's an example:
import matplotlib.pyplot as plt
from matplotlib.widgets import Slider
import numpy as np

fig, ax = plt.subplots(figsize=(8, 6))
plt.subplots_adjust(left=0.25, bottom=0.25)

x = np.linspace(-3, 3, 100)
y = np.linspace(-3, 3, 100)
X, Y = np.meshgrid(x, y)
Z = np.exp(-(X**2 + Y**2))

contour = ax.contourf(X, Y, Z, levels=10)
plt.colorbar(contour)

slider_ax = plt.axes([0.05, 0.25, 0.0225, 0.63])
levels_slider = Slider(
    ax=slider_ax,
    label='Levels',
    valmin=3,
    valmax=50,
    valinit=10,
    orientation='vertical',
    valstep=1
)

def update(val):
    ax.clear()
    contour = ax.contourf(X, Y, Z, levels=int(levels_slider.val))
    plt.colorbar(contour)
    fig.canvas.draw_idle()

levels_slider.on_changed(update)

plt.title("Contour Level Control with Vertical Slider - how2matplotlib.com")
plt.show()
Output:
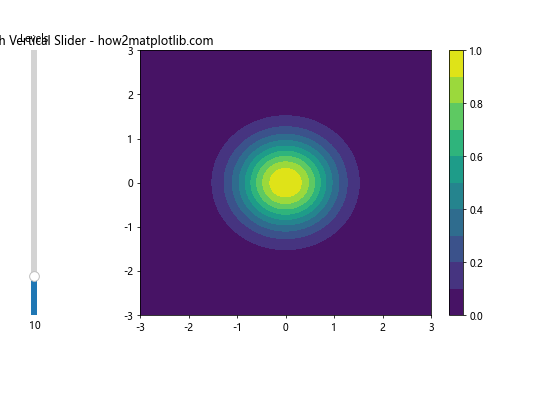
This example shows how to use a vertical slider to control the number of levels in a contour plot. As the slider is adjusted, the contour plot is redrawn with the new number of levels.
Vertical Sliders for 3D Plot Rotation
You can also add a vertical slider with matplotlib to control the viewing angle of a 3D plot. Here's an example:
import matplotlib.pyplot as plt
from matplotlib.widgets import Slider
import numpy as np
from mpl_toolkits.mplot3d import Axes3D

fig = plt.figure(figsize=(8, 6))
ax = fig.add_subplot(111, projection='3d')
plt.subplots_adjust(left=0.25, bottom=0.25)

x = np.linspace(-5, 5, 100)
y = np.linspace(-5, 5, 100)
X, Y = np.meshgrid(x, y)
Z = np.sin(np.sqrt(X**2 + Y**2))

surface = ax.plot_surface(X, Y, Z, cmap='viridis')

slider_ax = plt.axes([0.05, 0.25, 0.0225, 0.63])
elev_slider = Slider(
    ax=slider_ax,
    label='Elevation',
    valmin=0,
    valmax=90,
    valinit=30,
    orientation='vertical'
)

def update(val):
    ax.view_init(elev=elev_slider.val, azim=ax.azim)
    fig.canvas.draw_idle()

elev_slider.on_changed(update)

plt.title("3D Plot Rotation with Vertical Slider - how2matplotlib.com")
plt.show()
Output:
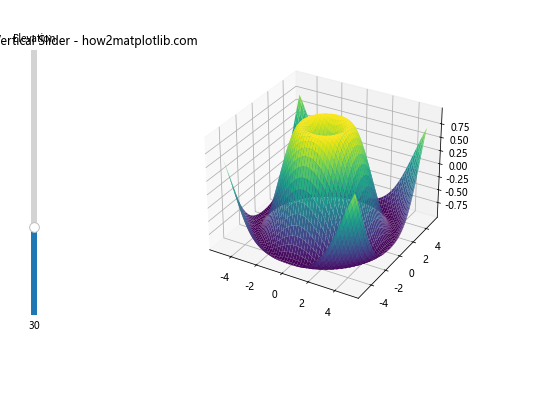
In this example, we use a vertical slider to control the elevation angle of a 3D surface plot. As the slider is adjusted, the viewing angle of the plot changes, allowing for interactive exploration of the 3D surface.
Conclusion
Learning how to add a vertical slider with matplotlib opens up a world of possibilities for creating interactive and dynamic visualizations. From simple parameter adjustments to complex data filtering and animation control, vertical sliders provide an intuitive way for users to interact with your plots.
Throughout this guide, we've explored various applications of vertical sliders in matplotlib, including:
- Basic implementation of a vertical slider
- Customizing the appearance of vertical sliders
- Using multiple vertical sliders
- Combining vertical and horizontal sliders
- Adding labels and annotations to vertical sliders
- Using vertical sliders for data filtering
- Controlling color mapping with vertical sliders
- Animation control using vertical sliders
- Zoom control with vertical sliders
- Histogram bin control using vertical sliders
- Contour plot level control with vertical sliders
- 3D plot rotation using vertical sliders
Each of these examples demonstrates the versatility and power of vertical sliders in matplotlib. By incorporating these techniques into your own visualizations, you can create more engaging and interactive plots that allow users to explore data in meaningful ways.
Remember, when you add a vertical slider with matplotlib, you're not just adding a control element – you're opening up new dimensions of interactivity in your data visualizations. Experiment with different combinations and applications of vertical sliders to find the best way to present your data and engage your audience.