How to Set the X and Y Limits in Matplotlib
How to set the X and Y limits in Matplotlib is an essential skill for data visualization in Python. This article will provide a detailed exploration of the various methods and techniques to control the X and Y axis limits in Matplotlib plots. We’ll cover everything from basic limit setting to advanced customization options, ensuring you have a thorough understanding of how to set the X and Y limits in Matplotlib.
Understanding the Importance of Setting X and Y Limits in Matplotlib
Before diving into the specifics of how to set the X and Y limits in Matplotlib, it’s crucial to understand why this skill is so important. Setting appropriate limits for your plot axes can significantly impact the clarity and effectiveness of your data visualization. By learning how to set the X and Y limits in Matplotlib, you gain control over:
- The range of data displayed
- The focus of your visualization
- The overall appearance and readability of your plot
Mastering how to set the X and Y limits in Matplotlib allows you to create more professional and informative visualizations that effectively communicate your data insights.
Basic Methods to Set X and Y Limits in Matplotlib
Let’s start with the fundamental methods for setting X and Y limits in Matplotlib. These basic techniques will form the foundation for more advanced limit-setting strategies.
Using plt.xlim() and plt.ylim()
The simplest way to set X and Y limits in Matplotlib is by using the plt.xlim() and plt.ylim() functions. These functions allow you to specify the minimum and maximum values for each axis.
Here’s a basic example of how to set the X and Y limits in Matplotlib using these functions:
import matplotlib.pyplot as plt
import numpy as np

x = np.linspace(0, 10, 100)
y = np.sin(x)

plt.plot(x, y)
plt.xlim(0, 8)
plt.ylim(-1.5, 1.5)
plt.title('How to Set X and Y Limits in Matplotlib - how2matplotlib.com')
plt.show()
Output:
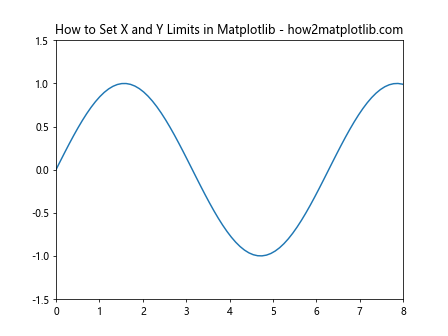
In this example, we’ve set the X-axis limits from 0 to 8 and the Y-axis limits from -1.5 to 1.5. This demonstrates how to set the X and Y limits in Matplotlib using the most straightforward method.
Using ax.set_xlim() and ax.set_ylim()
When working with Matplotlib’s object-oriented interface, you can use the set_xlim() and set_ylim() methods of the Axes object. This approach is particularly useful when you’re dealing with multiple subplots or need more fine-grained control over your plot elements.
Here’s an example of how to set the X and Y limits in Matplotlib using these methods:
import matplotlib.pyplot as plt
import numpy as np

fig, ax = plt.subplots()

x = np.linspace(0, 10, 100)
y = np.cos(x)

ax.plot(x, y)
ax.set_xlim(2, 8)
ax.set_ylim(-1.2, 1.2)
ax.set_title('How to Set X and Y Limits in Matplotlib - how2matplotlib.com')
plt.show()
Output:
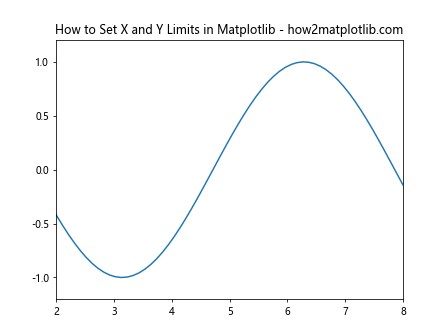
This example demonstrates how to set the X and Y limits in Matplotlib using the Axes object methods. We’ve set the X-axis limits from 2 to 8 and the Y-axis limits from -1.2 to 1.2.
Advanced Techniques for Setting X and Y Limits in Matplotlib
Now that we’ve covered the basics of how to set the X and Y limits in Matplotlib, let’s explore some more advanced techniques that offer greater flexibility and control.
Setting Limits with Data-Driven Values
Often, you’ll want to set your limits based on the data itself. Matplotlib provides several ways to achieve this, allowing you to create dynamic and responsive visualizations.
Using min() and max() Functions
One way to set data-driven limits is by using Python’s built-in min() and max() functions. Here’s an example of how to set the X and Y limits in Matplotlib based on your data:
import matplotlib.pyplot as plt
import numpy as np

x = np.random.rand(50) * 10
y = np.random.rand(50) * 5

plt.scatter(x, y)
plt.xlim(min(x) - 0.5, max(x) + 0.5)
plt.ylim(min(y) - 0.2, max(y) + 0.2)
plt.title('How to Set X and Y Limits in Matplotlib - how2matplotlib.com')
plt.show()
Output:
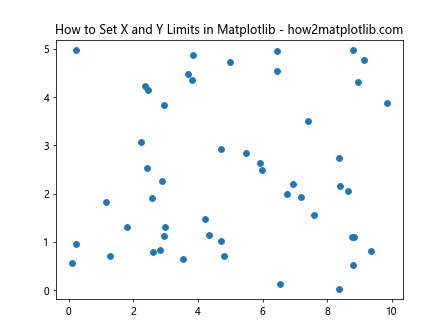
In this example, we’ve set the X and Y limits based on the minimum and maximum values of our data, with a small buffer added for better visibility. This demonstrates how to set the X and Y limits in Matplotlib dynamically based on your dataset.
Using numpy’s min() and max() Functions
For larger datasets or when working with numpy arrays, it’s often more efficient to use numpy’s min() and max() functions. Here’s how to set the X and Y limits in Matplotlib using this approach:
import matplotlib.pyplot as plt
import numpy as np

x = np.random.normal(0, 1, 1000)
y = np.random.normal(0, 1, 1000)

plt.scatter(x, y, alpha=0.5)
plt.xlim(np.min(x) - 0.5, np.max(x) + 0.5)
plt.ylim(np.min(y) - 0.5, np.max(y) + 0.5)
plt.title('How to Set X and Y Limits in Matplotlib - how2matplotlib.com')
plt.show()
Output:
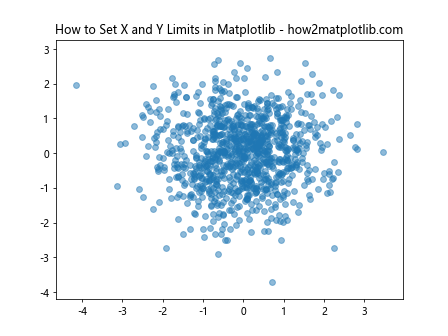
This example shows how to set the X and Y limits in Matplotlib for a larger dataset using numpy’s functions, which can be more efficient for array operations.
Setting Asymmetric Limits
Sometimes, you may want to set asymmetric limits around a central point. This can be useful for highlighting specific aspects of your data. Here’s how to set the X and Y limits in Matplotlib asymmetrically:
import matplotlib.pyplot as plt
import numpy as np

x = np.linspace(-5, 5, 100)
y = x**2

plt.plot(x, y)
plt.xlim(-3, 5)
plt.ylim(0, 20)
plt.axhline(y=0, color='k', linestyle='--')
plt.axvline(x=0, color='k', linestyle='--')
plt.title('How to Set X and Y Limits in Matplotlib - how2matplotlib.com')
plt.show()
Output:
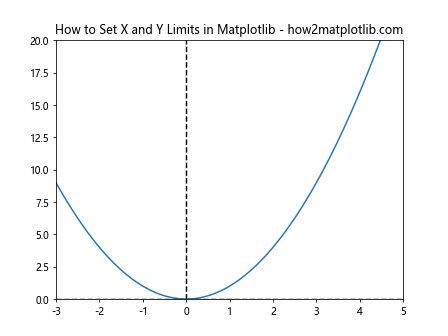
In this example, we’ve set asymmetric limits for both the X and Y axes. The X-axis ranges from -3 to 5, while the Y-axis ranges from 0 to 20. This demonstrates how to set the X and Y limits in Matplotlib to focus on specific regions of interest in your data.
Setting Limits with Margin
Matplotlib allows you to add margins to your plots, which can improve the appearance and readability of your visualizations. Let’s explore how to set the X and Y limits in Matplotlib with margins.
Using set_xlim() and set_ylim() with Margins
You can add margins to your limits by adjusting the values you pass to set_xlim() and set_ylim(). Here’s an example:
import matplotlib.pyplot as plt
import numpy as np

x = np.linspace(0, 10, 100)
y = np.sin(x)

fig, ax = plt.subplots()
ax.plot(x, y)

x_margin = 0.5
y_margin = 0.2

ax.set_xlim(min(x) - x_margin, max(x) + x_margin)
ax.set_ylim(min(y) - y_margin, max(y) + y_margin)
ax.set_title('How to Set X and Y Limits in Matplotlib with Margins - how2matplotlib.com')
plt.show()
Output:
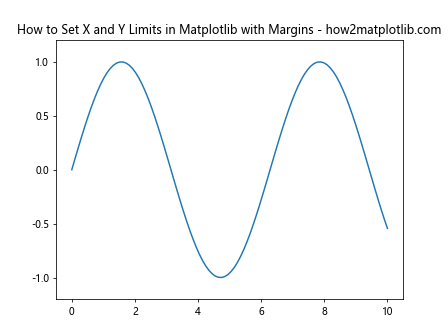
This example demonstrates how to set the X and Y limits in Matplotlib with custom margins, providing some breathing room around your data.
Using margins() Method
Matplotlib also provides a convenient margins() method that allows you to set margins as a proportion of the data range. Here’s how to set the X and Y limits in Matplotlib using this method:
import matplotlib.pyplot as plt
import numpy as np

x = np.linspace(0, 10, 100)
y = np.cos(x)

fig, ax = plt.subplots()
ax.plot(x, y)
ax.margins(x=0.1, y=0.2)
ax.set_title('How to Set X and Y Limits in Matplotlib with margins() - how2matplotlib.com')
plt.show()
Output:
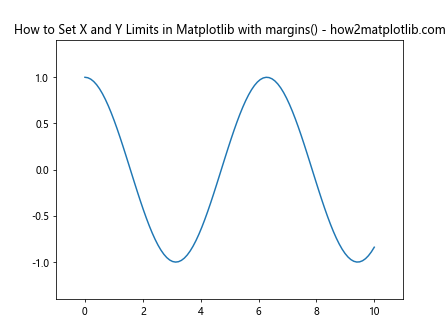
In this example, we’ve set a 10% margin on the X-axis and a 20% margin on the Y-axis. This method provides a simple way to add proportional margins to your plot.
Automatic Limit Setting in Matplotlib
While manually setting limits gives you precise control, Matplotlib also offers automatic limit setting features that can be very useful in certain situations.
Using autoscale() Method
The autoscale() method allows Matplotlib to automatically determine appropriate limits based on your data. Here’s an example of how to use autoscale to set the X and Y limits in Matplotlib:
import matplotlib.pyplot as plt
import numpy as np

x = np.random.rand(50) * 10
y = np.random.rand(50) * 5

fig, ax = plt.subplots()
ax.scatter(x, y)
ax.autoscale(tight=True)
ax.set_title('How to Set X and Y Limits in Matplotlib with autoscale() - how2matplotlib.com')
plt.show()
Output:
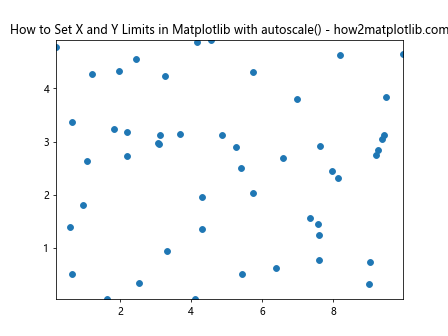
In this example, autoscale(tight=True) sets the limits to fit the data exactly. This demonstrates how to set the X and Y limits in Matplotlib automatically while ensuring all data points are visible.
Using axis(‘tight’) Method
Another way to automatically set limits is by using the axis('tight') method. This method adjusts the limits to fit the data tightly. Here’s how to set the X and Y limits in Matplotlib using this approach:
import matplotlib.pyplot as plt
import numpy as np

x = np.linspace(0, 10, 100)
y = np.sin(x) * np.exp(-0.1 * x)

plt.plot(x, y)
plt.axis('tight')
plt.title('How to Set X and Y Limits in Matplotlib with axis("tight") - how2matplotlib.com')
plt.show()
Output:
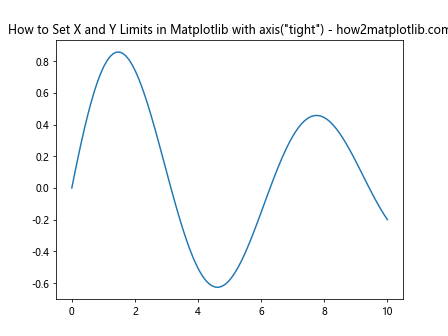
This example shows how to set the X and Y limits in Matplotlib to fit the data tightly using the axis('tight') method.
Setting Limits for Different Plot Types
Different types of plots may require different approaches to setting limits. Let’s explore how to set the X and Y limits in Matplotlib for various plot types.
Setting Limits for Scatter Plots
Scatter plots often benefit from limits that provide some padding around the data points. Here’s an example of how to set the X and Y limits in Matplotlib for a scatter plot:
import matplotlib.pyplot as plt
import numpy as np

x = np.random.randn(100)
y = np.random.randn(100)

fig, ax = plt.subplots()
ax.scatter(x, y)

padding = 0.5
ax.set_xlim(min(x) - padding, max(x) + padding)
ax.set_ylim(min(y) - padding, max(y) + padding)
ax.set_title('How to Set X and Y Limits in Matplotlib for Scatter Plots - how2matplotlib.com')
plt.show()
Output:
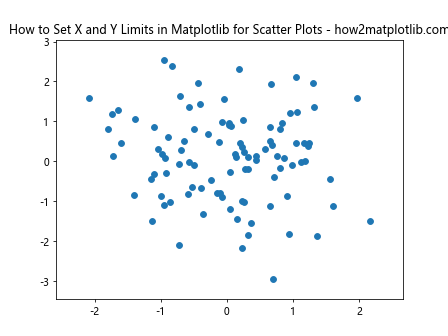
This example demonstrates how to set the X and Y limits in Matplotlib for a scatter plot, adding padding to ensure all points are clearly visible.
Setting Limits for Bar Plots
For bar plots, you might want to set the Y-axis limit to start at zero to avoid misrepresentation. Here’s how to set the X and Y limits in Matplotlib for a bar plot:
import matplotlib.pyplot as plt
import numpy as np

categories = ['A', 'B', 'C', 'D', 'E']
values = np.random.randint(1, 30, 5)

fig, ax = plt.subplots()
ax.bar(categories, values)

ax.set_ylim(0, max(values) * 1.2)  # Set Y-axis to start at 0 with 20% headroom
ax.set_title('How to Set X and Y Limits in Matplotlib for Bar Plots - how2matplotlib.com')
plt.show()
Output:
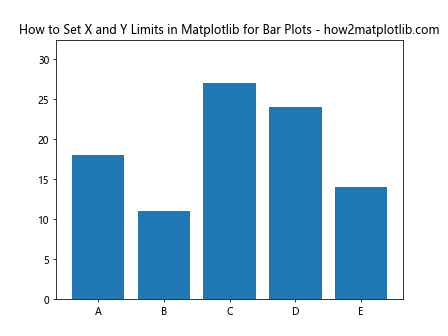
This example shows how to set the X and Y limits in Matplotlib for a bar plot, ensuring the Y-axis starts at zero and provides some headroom above the highest bar.
Setting Limits for Logarithmic Scales
When working with logarithmic scales, setting limits requires a slightly different approach. Let’s explore how to set the X and Y limits in Matplotlib for log scales.
Setting Limits for Log Scale on Y-axis
Here’s an example of how to set the X and Y limits in Matplotlib for a plot with a logarithmic Y-axis:
import matplotlib.pyplot as plt
import numpy as np

x = np.linspace(0, 10, 100)
y = np.exp(x)

fig, ax = plt.subplots()
ax.semilogy(x, y)

ax.set_xlim(0, 10)
ax.set_ylim(1, 1e5)
ax.set_title('How to Set X and Y Limits in Matplotlib for Log Scale - how2matplotlib.com')
plt.show()
Output:
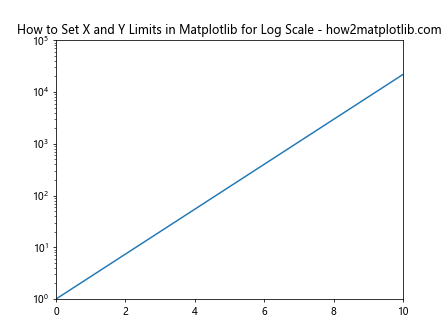
This example demonstrates how to set the X and Y limits in Matplotlib for a plot with a logarithmic Y-axis. Note that the Y-limits are set using regular numbers, not log values.
Setting Limits for Log-Log Plot
For a log-log plot, you’ll need to set both X and Y limits appropriately. Here’s how to set the X and Y limits in Matplotlib for a log-log plot:
import matplotlib.pyplot as plt
import numpy as np

x = np.logspace(0, 3, 50)
y = x**2

fig, ax = plt.subplots()
ax.loglog(x, y)

ax.set_xlim(1, 1e3)
ax.set_ylim(1, 1e6)
ax.set_title('How to Set X and Y Limits in Matplotlib for Log-Log Plot - how2matplotlib.com')
plt.show()
Output:
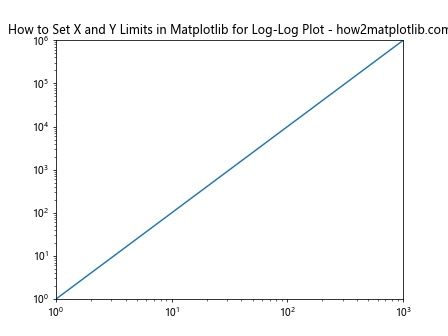
This example shows how to set the X and Y limits in Matplotlib for a log-log plot, ensuring appropriate ranges for both axes.
Advanced Limit Setting Techniques
Let’s explore some more advanced techniques for setting limits in Matplotlib, which can be useful in specific scenarios.
Setting Limits with Date Axes
When working with time series data, you might need to set limits using datetime objects. Here’s how to set the X and Y limits in Matplotlib for a plot with a date axis:
import matplotlib.pyplot as plt
import numpy as np
from datetime import datetime, timedelta

dates = [datetime(2023, 1, 1) + timedelta(days=i) for i in range(100)]
values = np.cumsum(np.random.randn(100))

fig, ax = plt.subplots()
ax.plot(dates, values)

ax.set_xlim(datetime(2023, 1, 1), datetime(2023, 4, 10))
ax.set_ylim(min(values), max(values))
ax.set_title('How to Set X and Y Limits in Matplotlib with Date Axis - how2matplotlib.com')
plt.show()
Output:
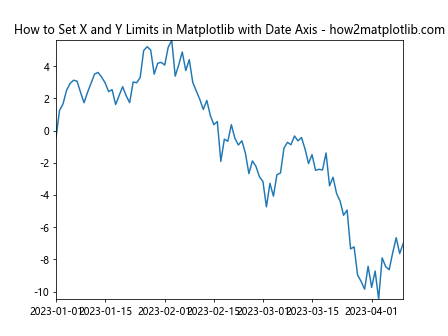
This example demonstrates how to set the X and Y limits in Matplotlib for a plot with a date axis, using datetime objects to specify the X-axis limits.
Setting Limits for Multiple Subplots
When working with multiple subplots, you might want to set consistent limits across all plots. Here’s how to set the X and Y limits in Matplotlib for multiple subplots:
import matplotlib.pyplot as plt
import numpy as np

x = np.linspace(0, 10, 100)
y1 = np.sin(x)
y2 = np.cos(x)
y3 = np.tan(x)

fig, (ax1, ax2, ax3) = plt.subplots(3, 1, figsize=(8, 12), sharex=True)

ax1.plot(x, y1)
ax2.plot(x, y2)
ax3.plot(x, y3)

for ax in (ax1, ax2, ax3):
    ax.set_xlim(0, 10)
    ax.set_ylim(-2, 2)

fig.suptitle('How to Set X and Y Limits in Matplotlib for Multiple Subplots - how2matplotlib.com')
plt.tight_layout()
plt.show()
Output:
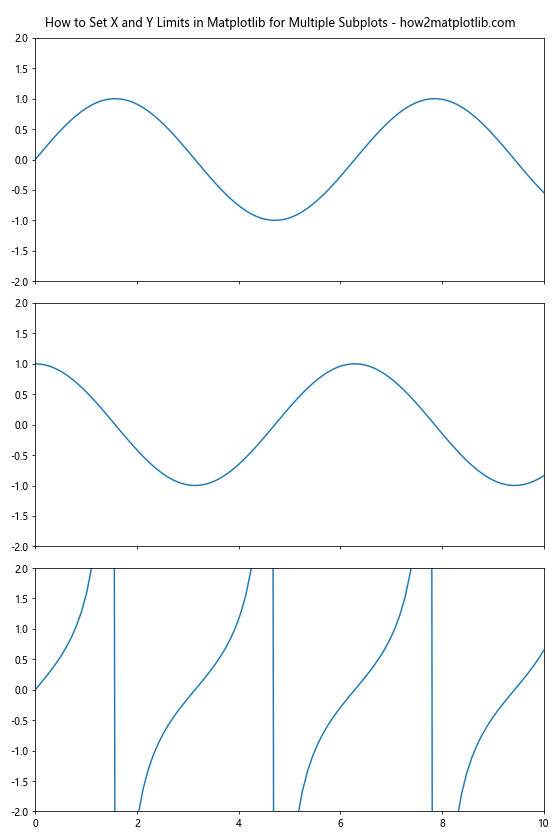
This example shows how to set the X and Y limits in Matplotlib consistently across multiple subplots, ensuring a uniform appearance for your multi-plot figure.
Dynamically Updating Limits
In some cases, you might need to update the limits of your plot dynamically, such as when new data is added or when you want to implement interactive features.
Using set_xlim() and set_ylim() to Update Limits
You can use set_xlim() and set_ylim() to update the limits of an existing plot. Here’s an example of how to dynamically set the X and Y limits in Matplotlib:
import matplotlib.pyplot as plt
import numpy as np

fig, ax = plt.subplots()

x = np.linspace(0, 10, 100)
y = np.sin(x)

line, = ax.plot(x, y)
ax.set_title('How to Set X and Y Limits in Matplotlib Dynamically - how2matplotlib.com')

for i in range(5):
    y = np.sin(x + i)
    line.set_ydata(y)
    ax.set_ylim(min(y) - 0.1, max(y) + 0.1)
    plt.pause(0.5)

plt.show()
Output:
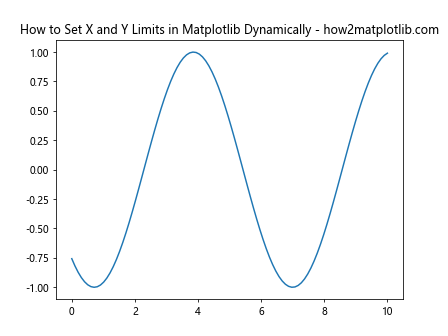
This example demonstrates how to set the X and Y limits in Matplotlib dynamically as the data changes over time.
Using relim() and autoscale_view() for Automatic Updates
For more complex scenarios where you’re adding or removing data, you can use relim() to recalculate the data limits and autoscale_view() to update the view. Here’s how to set the X and Y limits in Matplotlib automatically as data changes:
import matplotlib.pyplot as plt
import numpy as np

fig, ax = plt.subplots()
ax.set_title('How to Set X and Y Limits in Matplotlib with relim() and autoscale_view() - how2matplotlib.com')

x = []
y = []

for i in range(100):
    x.append(i)
    y.append(np.random.rand())
    ax.clear()
    ax.plot(x, y)
    ax.relim()
    ax.autoscale_view()
    plt.pause(0.1)

plt.show()
This example shows how to set the X and Y limits in Matplotlib automatically as new data points are added to the plot.
Customizing Limit Appearance
In addition to setting the numerical values of the limits, you can also customize their appearance to enhance the visual appeal of your plots.
Setting Tick Locations and Labels
You can customize the tick locations and labels when setting limits. Here’s an example of how to set the X and Y limits in Matplotlib with custom ticks:
import matplotlib.pyplot as plt
import numpy as np

x = np.linspace(0, 10, 100)
y = np.sin(x)

fig, ax = plt.subplots()
ax.plot(x, y)

ax.set_xlim(0, 10)
ax.set_ylim(-1, 1)

ax.set_xticks(np.arange(0, 11, 2))
ax.set_yticks(np.arange(-1, 1.1, 0.5))

ax.set_xticklabels(['Zero', '2', '4', '6', '8', 'Ten'])
ax.set_yticklabels(['-1', '-0.5', '0', '0.5', '1'])

ax.set_title('How to Set X and Y Limits in Matplotlib with Custom Ticks - how2matplotlib.com')
plt.show()
Output:
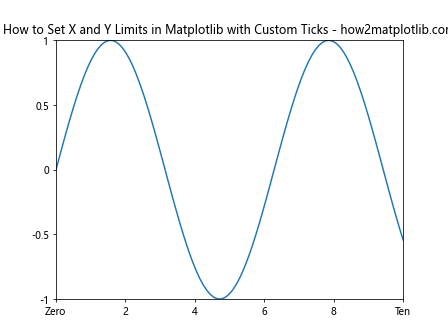
This example demonstrates how to set the X and Y limits in Matplotlib while also customizing the tick locations and labels for better readability.
Adding Grid Lines
Grid lines can help readers interpret your data more easily. Here’s how to set the X and Y limits in Matplotlib and add grid lines:
import matplotlib.pyplot as plt
import numpy as np

x = np.linspace(0, 10, 100)
y = np.cos(x)

fig, ax = plt.subplots()
ax.plot(x, y)

ax.set_xlim(0, 10)
ax.set_ylim(-1, 1)

ax.grid(True, linestyle='--', alpha=0.7)

ax.set_title('How to Set X and Y Limits in Matplotlib with Grid Lines - how2matplotlib.com')
plt.show()
Output:
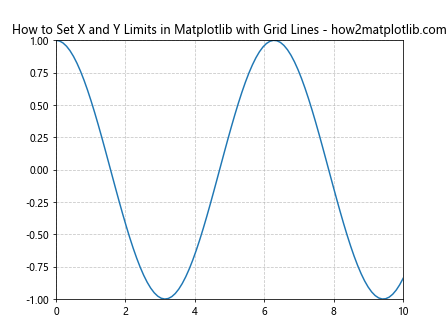
This example shows how to set the X and Y limits in Matplotlib and add grid lines to improve the readability of your plot.
Handling Special Cases
There are some special cases where setting limits requires additional consideration. Let’s explore a few of these scenarios.
Setting Limits for Polar Plots
Polar plots require a different approach to setting limits. Here’s how to set the radial and angular limits in Matplotlib for a polar plot:
import matplotlib.pyplot as plt
import numpy as np

theta = np.linspace(0, 2*np.pi, 100)
r = np.sin(4*theta)

fig, ax = plt.subplots(subplot_kw={'projection': 'polar'})
ax.plot(theta, r)

ax.set_rlim(0, 1)
ax.set_thetamin(0)
ax.set_thetamax(360)

ax.set_title('How to Set Limits in Matplotlib for Polar Plots - how2matplotlib.com')
plt.show()
Output:
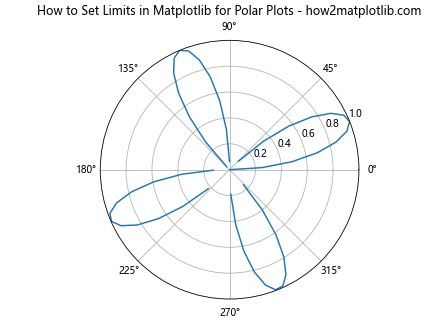
This example demonstrates how to set the radial and angular limits in Matplotlib for a polar plot.
Setting Limits for 3D Plots
For 3D plots, you need to set limits for all three axes. Here’s how to set the X, Y, and Z limits in Matplotlib for a 3D plot:
import matplotlib.pyplot as plt
import numpy as np

fig = plt.figure()
ax = fig.add_subplot(111, projection='3d')

x = np.random.rand(100) * 4 - 2
y = np.random.rand(100) * 4 - 2
z = np.random.rand(100) * 4 - 2

ax.scatter(x, y, z)

ax.set_xlim(-2, 2)
ax.set_ylim(-2, 2)
ax.set_zlim(-2, 2)

ax.set_title('How to Set X, Y, and Z Limits in Matplotlib for 3D Plots - how2matplotlib.com')
plt.show()
Output:
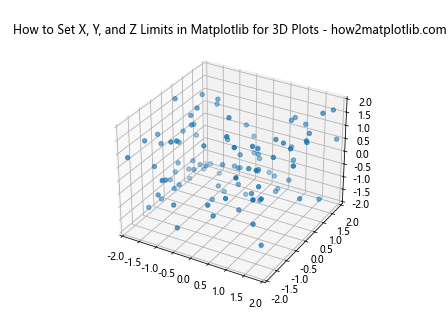
This example shows how to set the X, Y, and Z limits in Matplotlib for a 3D scatter plot.
Best Practices for Setting Limits in Matplotlib
To conclude our comprehensive guide on how to set the X and Y limits in Matplotlib, let’s discuss some best practices to keep in mind:
- Consider your data range: Always examine your data range before setting limits to ensure you’re not cutting off important information.
Use consistent limits: When comparing multiple plots, try to use consistent limits to avoid misleading comparisons.
Add margins: Adding small margins around your data can improve the readability of your plots.
Use automatic scaling when appropriate: For exploratory data analysis, automatic scaling can be a good starting point.
Be mindful of zero: For bar charts and other plots where the magnitude is important, consider whether your Y-axis should start at zero.
Use logarithmic scales when appropriate: For data that spans multiple orders of magnitude, consider using logarithmic scales.
Update limits dynamically: For interactive or real-time plots, remember to update your limits as new data comes in.
Customize tick marks and labels: Adjust tick marks and labels to enhance the readability of your plot.
Consider the aspect ratio: The aspect ratio of your plot can affect how the limits are perceived, so adjust it if necessary.
Document your choices: If you’re making specific choices about limits for a particular reason, consider adding annotations or comments to explain your reasoning.
By following these best practices and using the techniques we’ve covered in this guide, you’ll be well-equipped to effectively set the X and Y limits in Matplotlib for a wide range of data visualization scenarios.