How to Set the Spacing Between Subplots in Matplotlib
How to set the spacing between subplots in Matplotlib is an essential skill for creating visually appealing and well-organized data visualizations. Matplotlib, a popular plotting library in Python, offers various methods to adjust the spacing between subplots, allowing you to customize your plots to perfection. In this comprehensive guide, we’ll explore different techniques and best practices for setting subplot spacing in Matplotlib, providing you with the knowledge and tools to create professional-looking visualizations.
Understanding Subplot Spacing in Matplotlib
Before diving into the specifics of how to set the spacing between subplots in Matplotlib, it’s crucial to understand what subplot spacing means and why it’s important. Subplot spacing refers to the gaps or margins between individual plots when multiple plots are arranged in a grid layout. Proper spacing ensures that your plots are visually distinct, easy to read, and aesthetically pleasing.
Matplotlib provides several ways to control subplot spacing, including:
- Using
plt.subplots_adjust() - Utilizing
fig.tight_layout() - Employing
gridspecfor more advanced layouts - Adjusting individual subplot positions
Let’s explore each of these methods in detail and learn how to set the spacing between subplots in Matplotlib effectively.
Using plt.subplots_adjust() to Set Subplot Spacing
The plt.subplots_adjust() function is one of the most straightforward ways to set the spacing between subplots in Matplotlib. This function allows you to adjust the margins around the entire figure as well as the spacing between individual subplots.
Here’s a simple example demonstrating how to use plt.subplots_adjust():
import matplotlib.pyplot as plt
import numpy as np

# Create sample data
x = np.linspace(0, 10, 100)
y1 = np.sin(x)
y2 = np.cos(x)

# Create subplots
fig, (ax1, ax2) = plt.subplots(2, 1, figsize=(8, 6))

# Plot data
ax1.plot(x, y1, label='Sine')
ax1.set_title('Sine Wave - how2matplotlib.com')
ax1.legend()

ax2.plot(x, y2, label='Cosine')
ax2.set_title('Cosine Wave - how2matplotlib.com')
ax2.legend()

# Adjust subplot spacing
plt.subplots_adjust(hspace=0.5)

plt.show()
Output:
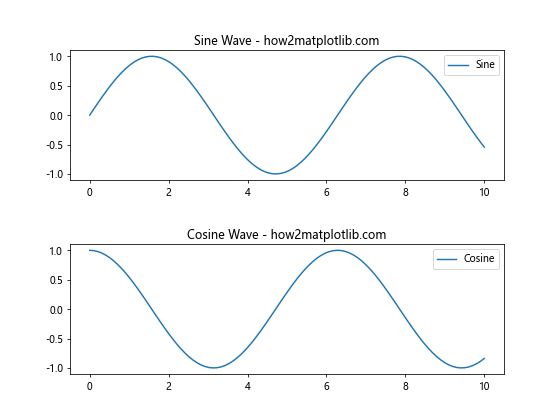
In this example, we create two subplots arranged vertically and use plt.subplots_adjust(hspace=0.5) to set the vertical spacing between them. The hspace parameter controls the height of the spacing between subplots as a fraction of the average subplot height.
You can also adjust other parameters using plt.subplots_adjust():
left: The left side of the subplots of the figureright: The right side of the subplots of the figurebottom: The bottom of the subplots of the figuretop: The top of the subplots of the figurewspace: The width of the padding between subplots, as a fraction of the average axis width
Here’s an example that demonstrates how to set multiple spacing parameters:
import matplotlib.pyplot as plt
import numpy as np
# Create sample data
x = np.linspace(0, 10, 100)
y1 = np.sin(x)
y2 = np.cos(x)
y3 = np.tan(x)
y4 = np.exp(-x/10)
# Create subplots
fig, ((ax1, ax2), (ax3, ax4)) = plt.subplots(2, 2, figsize=(10, 8))
# Plot data
ax1.plot(x, y1)
ax1.set_title('Sine - how2matplotlib.com')
ax2.plot(x, y2)
ax2.set_title('Cosine - how2matplotlib.com')
ax3.plot(x, y3)
ax3.set_title('Tangent - how2matplotlib.com')
ax4.plot(x, y4)
ax4.set_title('Exponential - how2matplotlib.com')
# Adjust subplot spacing
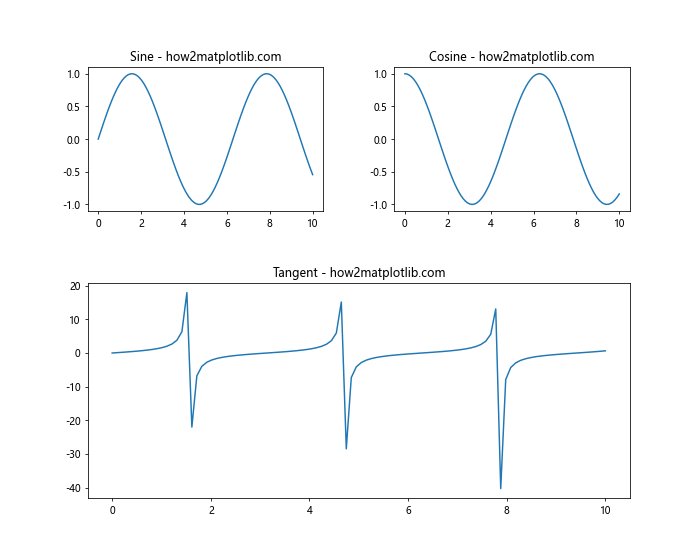
plt.subplots_adjust(left=0.1, right=0.95, bottom=0.1, top=0.95, wspace=0.3, hspace=0.4)
plt.show()
Output:
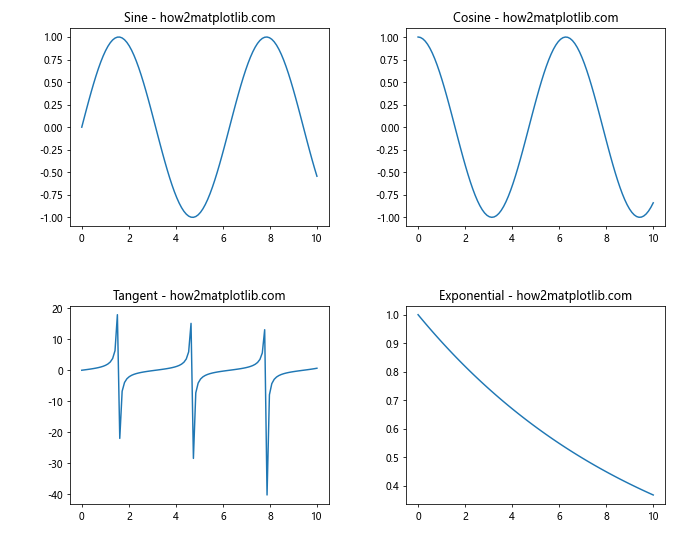
In this example, we create a 2×2 grid of subplots and adjust various spacing parameters to create a well-balanced layout. The wspace parameter controls the horizontal spacing between subplots, while hspace controls the vertical spacing.
Utilizing fig.tight_layout() for Automatic Spacing
While plt.subplots_adjust() gives you fine-grained control over subplot spacing, Matplotlib also offers an automatic spacing adjustment method called tight_layout(). This function automatically adjusts the spacing between subplots to minimize overlapping and ensure that all labels and titles are visible.
Here’s an example of how to use fig.tight_layout():
import matplotlib.pyplot as plt
import numpy as np

# Create sample data
x = np.linspace(0, 10, 100)
y1 = np.sin(x)
y2 = np.cos(x)
y3 = np.tan(x)

# Create subplots
fig, (ax1, ax2, ax3) = plt.subplots(3, 1, figsize=(8, 10))

# Plot data
ax1.plot(x, y1)
ax1.set_title('Sine Wave - how2matplotlib.com')

ax2.plot(x, y2)
ax2.set_title('Cosine Wave - how2matplotlib.com')

ax3.plot(x, y3)
ax3.set_title('Tangent Wave - how2matplotlib.com')

# Apply tight layout
fig.tight_layout()

plt.show()
Output:
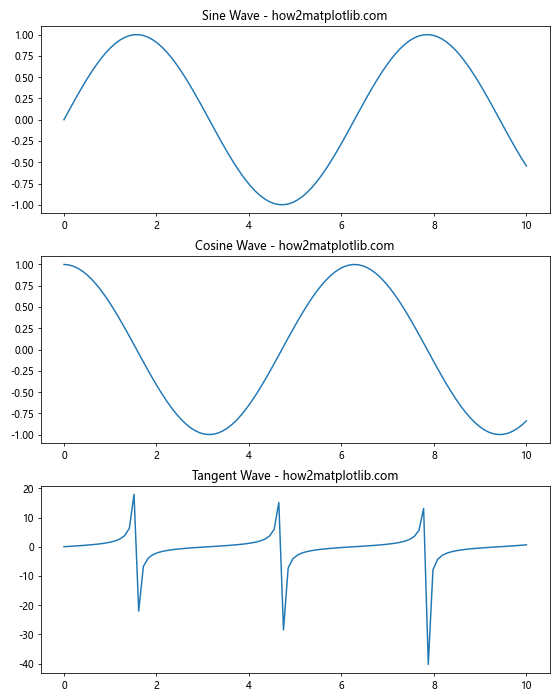
In this example, we create three subplots arranged vertically and use fig.tight_layout() to automatically adjust the spacing between them. This method is particularly useful when you have subplots with varying sizes or when you’re unsure about the optimal spacing values.
You can also pass parameters to tight_layout() to fine-tune its behavior:
import matplotlib.pyplot as plt
import numpy as np

# Create sample data
x = np.linspace(0, 10, 100)
y1 = np.sin(x)
y2 = np.cos(x)
y3 = np.tan(x)
y4 = np.exp(-x/10)

# Create subplots
fig, ((ax1, ax2), (ax3, ax4)) = plt.subplots(2, 2, figsize=(10, 8))

# Plot data
ax1.plot(x, y1)
ax1.set_title('Sine - how2matplotlib.com')

ax2.plot(x, y2)
ax2.set_title('Cosine - how2matplotlib.com')

ax3.plot(x, y3)
ax3.set_title('Tangent - how2matplotlib.com')

ax4.plot(x, y4)
ax4.set_title('Exponential - how2matplotlib.com')

# Apply tight layout with custom parameters
fig.tight_layout(pad=3.0, w_pad=2.0, h_pad=2.0)

plt.show()
Output:
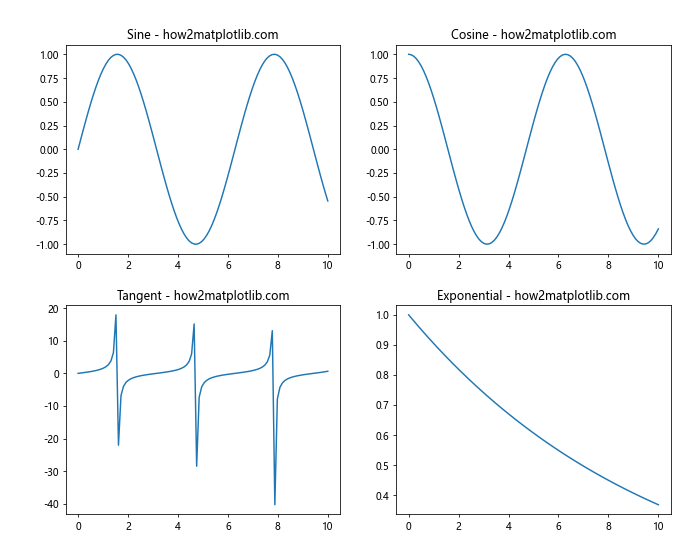
In this example, we use fig.tight_layout() with custom parameters to adjust the spacing between subplots. The pad parameter controls the padding around the entire figure, while w_pad and h_pad control the width and height padding between subplots, respectively.
Employing gridspec for Advanced Subplot Layouts
For more complex layouts or when you need precise control over subplot sizes and positions, Matplotlib’s gridspec module is an excellent choice. gridspec allows you to create a grid-like structure and place subplots within specific grid cells, giving you fine-grained control over the layout.
Here’s an example of how to use gridspec to set the spacing between subplots in Matplotlib:
import matplotlib.pyplot as plt
import matplotlib.gridspec as gridspec
import numpy as np

# Create sample data
x = np.linspace(0, 10, 100)
y1 = np.sin(x)
y2 = np.cos(x)
y3 = np.tan(x)

# Create figure and gridspec
fig = plt.figure(figsize=(10, 8))
gs = gridspec.GridSpec(2, 2, width_ratios=[1, 1], height_ratios=[1, 1.5], wspace=0.3, hspace=0.4)

# Create subplots
ax1 = fig.add_subplot(gs[0, 0])
ax2 = fig.add_subplot(gs[0, 1])
ax3 = fig.add_subplot(gs[1, :])

# Plot data
ax1.plot(x, y1)
ax1.set_title('Sine - how2matplotlib.com')

ax2.plot(x, y2)
ax2.set_title('Cosine - how2matplotlib.com')

ax3.plot(x, y3)
ax3.set_title('Tangent - how2matplotlib.com')

plt.show()
Output:
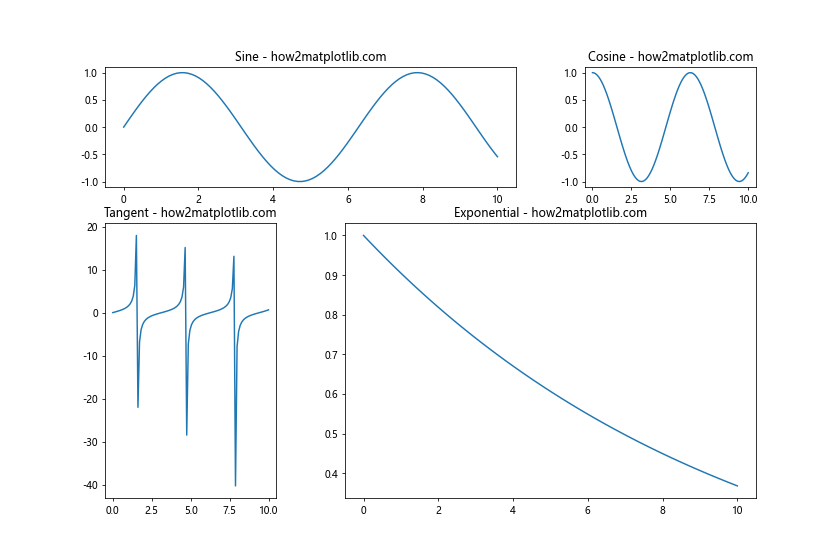
In this example, we create a 2×2 grid using gridspec.GridSpec() and specify custom width and height ratios for the rows and columns. We also set the wspace and hspace parameters to control the spacing between subplots. The third subplot spans both columns in the second row, demonstrating the flexibility of gridspec.
You can further customize the layout by adjusting individual subplot positions:
import matplotlib.pyplot as plt
import matplotlib.gridspec as gridspec
import numpy as np

# Create sample data
x = np.linspace(0, 10, 100)
y1 = np.sin(x)
y2 = np.cos(x)
y3 = np.tan(x)
y4 = np.exp(-x/10)

# Create figure and gridspec
fig = plt.figure(figsize=(12, 8))
gs = gridspec.GridSpec(3, 3, wspace=0.4, hspace=0.3)

# Create subplots
ax1 = fig.add_subplot(gs[0, :2])
ax2 = fig.add_subplot(gs[0, 2])
ax3 = fig.add_subplot(gs[1:, 0])
ax4 = fig.add_subplot(gs[1:, 1:])

# Plot data
ax1.plot(x, y1)
ax1.set_title('Sine - how2matplotlib.com')

ax2.plot(x, y2)
ax2.set_title('Cosine - how2matplotlib.com')

ax3.plot(x, y3)
ax3.set_title('Tangent - how2matplotlib.com')

ax4.plot(x, y4)
ax4.set_title('Exponential - how2matplotlib.com')

plt.show()
Output:
In this example, we create a 3×3 grid and place subplots in specific grid cells, creating a more complex layout. The wspace and hspace parameters control the spacing between subplots, while the subplot positions are determined by their grid cell assignments.
Adjusting Individual Subplot Positions
Sometimes, you may need to fine-tune the position of individual subplots to achieve the desired spacing. Matplotlib provides the ax.set_position() method to adjust the position and size of individual subplots.
Here’s an example of how to use ax.set_position() to set the spacing between subplots in Matplotlib:
import matplotlib.pyplot as plt
import numpy as np

# Create sample data
x = np.linspace(0, 10, 100)
y1 = np.sin(x)
y2 = np.cos(x)

# Create subplots
fig, (ax1, ax2) = plt.subplots(2, 1, figsize=(8, 8))

# Plot data
ax1.plot(x, y1)
ax1.set_title('Sine - how2matplotlib.com')

ax2.plot(x, y2)
ax2.set_title('Cosine - how2matplotlib.com')

# Adjust subplot positions
ax1.set_position([0.1, 0.55, 0.8, 0.35])
ax2.set_position([0.1, 0.1, 0.8, 0.35])

plt.show()
Output:
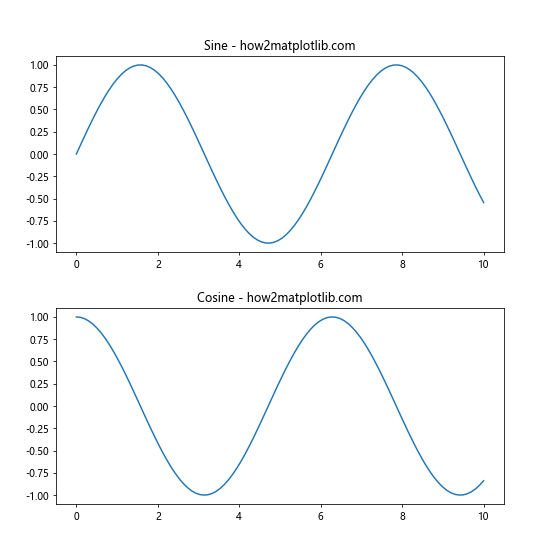
In this example, we create two subplots and use ax.set_position() to manually adjust their positions. The set_position() method takes a list of four values: [left, bottom, width, height], where each value is a fraction of the figure dimensions.
You can combine this approach with other spacing methods for even more control:
import matplotlib.pyplot as plt
import numpy as np

# Create sample data
x = np.linspace(0, 10, 100)
y1 = np.sin(x)
y2 = np.cos(x)
y3 = np.tan(x)

# Create subplots
fig, (ax1, ax2, ax3) = plt.subplots(3, 1, figsize=(8, 10))

# Plot data
ax1.plot(x, y1)
ax1.set_title('Sine - how2matplotlib.com')

ax2.plot(x, y2)
ax2.set_title('Cosine - how2matplotlib.com')

ax3.plot(x, y3)
ax3.set_title('Tangent - how2matplotlib.com')

# Adjust subplot positions
ax1.set_position([0.1, 0.7, 0.8, 0.25])
ax2.set_position([0.1, 0.4, 0.8, 0.25])
ax3.set_position([0.1, 0.1, 0.8, 0.25])

# Add overall title
fig.suptitle('Trigonometric Functions - how2matplotlib.com', fontsize=16)

plt.show()
Output:
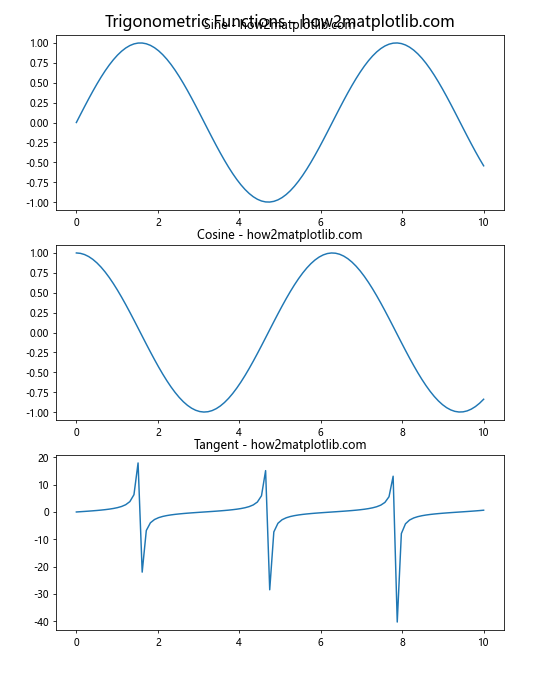
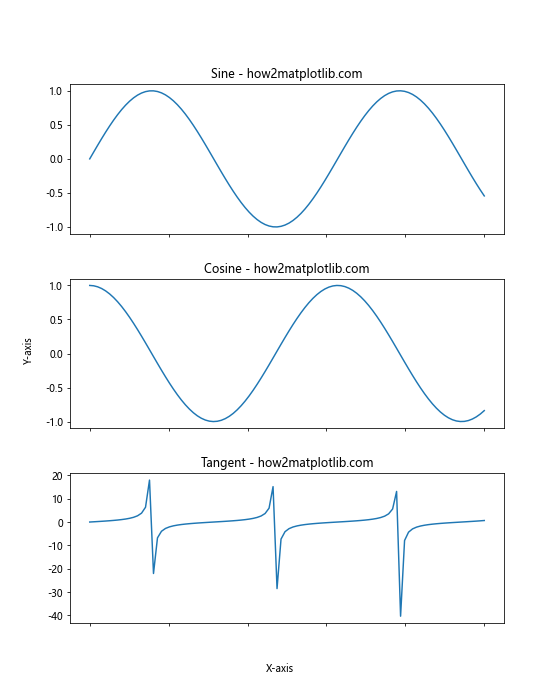
In this example, we manually adjust the positions of three subplots and add an overall title to the figure using fig.suptitle(). This approach gives you precise control over the layout and spacing of your subplots.
Best Practices for Setting Subplot Spacing
When learning how to set the spacing between subplots in Matplotlib, it’s important to keep some best practices in mind:
- Consistency: Try to maintain consistent spacing between subplots for a professional look.
- Readability: Ensure that labels, titles, and tick marks are not overlapping or cut off.
- White space: Use appropriate white space to separate subplots without making them feel disconnected.
- Aspect ratio: Consider the aspect ratio of your plots when adjusting spacing.
- Content-aware spacing: Adjust spacing based on the content of your plots (e.g., more space for plots with long titles or labels).
Here’s an example that demonstrates these best practices:
import matplotlib.pyplot as plt
import numpy as np

# Create sample data
x = np.linspace(0, 10, 100)
y1 = np.sin(x)
y2 = np.cos(x)
y3 = np.tan(x)
y4 = np.exp(-x/10)

# Create subplots
fig, ((ax1, ax2), (ax3, ax4)) = plt.subplots(2, 2, figsize=(12, 10))

# Plot data
ax1.plot(x, y1)
ax1.set_title('Sine Wave - how2matplotlib.com')
ax1.set_xlabel('X-axis')
ax1.set_ylabel('Y-axis')

ax2.plot(x, y2)
ax2.set_title('Cosine Wave - how2matplotlib.com')
ax2.set_xlabel('X-axis')
ax2.set_ylabel('Y-axis')

ax3.plot(x, y3)
ax3.set_title('Tangent Wave - how2matplotlib.com')
ax3.set_xlabel('X-axis')
ax3.set_ylabel('Y-axis')

ax4.plot(x, y4)
ax4.set_title('Exponential Decay - how2matplotlib.com')
ax4.set_xlabel('X-axis')
ax4.set_ylabel('Y-axis')

# Adjust subplot spacing
plt.tight_layout(pad=3.0, w_pad=2.0, h_pad=3.0)

# Add overall title
fig.suptitle('Trigonometric and Exponential Functions', fontsize=16, y=0.98)

plt.show()
Output:
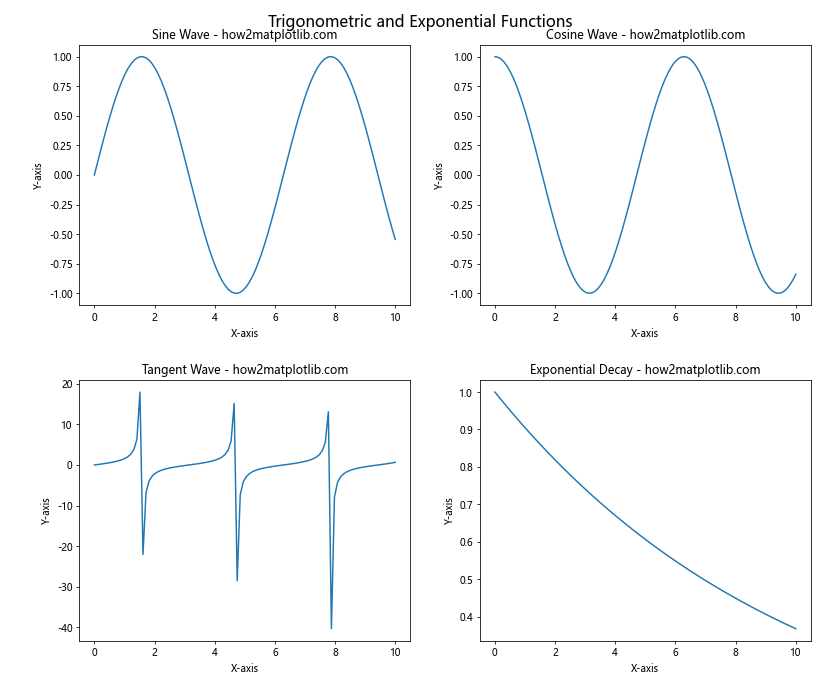
In this example, we create a 2×2 grid of subplots and apply best practices for spacing:
- We use
tight_layout()with custom padding to ensure consistent spacing. - Labels and titles are added to each subplot for clarity.
- Appropriate white space is maintained between subplots.
- The aspect ratio of the figure is adjusted to accommodate all subplots comfortably.
- Extra vertical space is added to accommodate the overall title.
Advanced Techniques for Subplot Spacing
As you become more proficient in setting the spacing between subplots in Matplotlib, you may want to explore some advanced techniques to create even more sophisticated layouts.
Using Nested GridSpecs
For complex layouts, you can use nested GridSpecs to create hierarchical structures within your figure:
import matplotlib.pyplot as plt
import matplotlib.gridspec as gridspec
import numpy as np

# Create sample data
x = np.linspace(0, 10, 100)
y1 = np.sin(x)
y2 = np.cos(x)
y3 = np.tan(x)
y4 = np.exp(-x/10)

# Create figure and outer gridspec
fig = plt.figure(figsize=(12, 8))
outer_grid = gridspec.GridSpec(2, 2, wspace=0.4, hspace=0.3)

# Create nested gridspecs
inner_grid1 = gridspec.GridSpecFromSubplotSpec(2, 1, subplot_spec=outer_grid[0, 0], hspace=0.3)
inner_grid2 = gridspec.GridSpecFromSubplotSpec(1, 2, subplot_spec=outer_grid[0, 1], wspace=0.3)

# Create subplots
ax1 = fig.add_subplot(inner_grid1[0])
ax2 = fig.add_subplot(inner_grid1[1])
ax3 = fig.add_subplot(inner_grid2[0])
ax4 = fig.add_subplot(inner_grid2[1])
ax5 = fig.add_subplot(outer_grid[1, :])

# Plot data
ax1.plot(x, y1)
ax1.set_title('Sine - how2matplotlib.com')

ax2.plot(x, y2)
ax2.set_title('Cosine - how2matplotlib.com')

ax3.plot(x, y3)
ax3.set_title('Tangent - how2matplotlib.com')

ax4.plot(x, y4)
ax4.set_title('Exponential - how2matplotlib.com')

ax5.plot(x, y1 * y2)
ax5.set_title('Sine * Cosine - how2matplotlib.com')

plt.show()
Output:
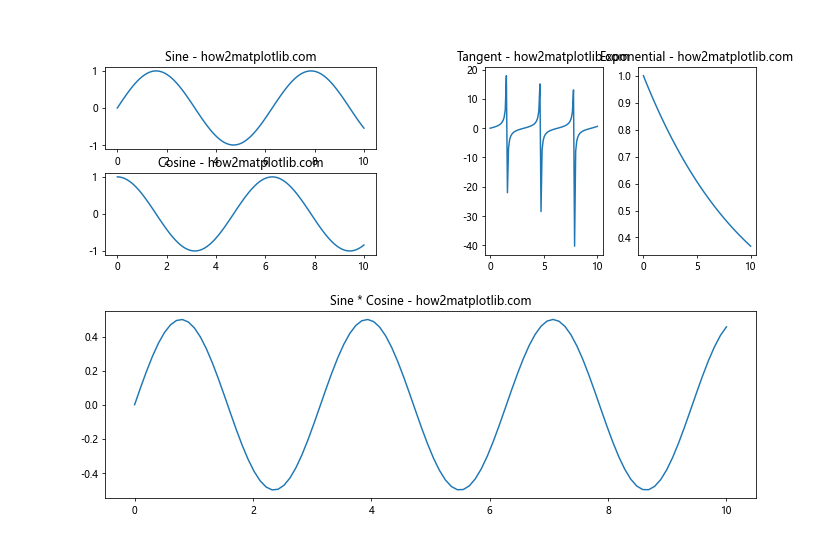
In this example, we create a complex layout using nested GridSpecs. The outer GridSpec defines the overall structure, while the inner GridSpecs allow for more detailed control over specific regions of the figure.
Using Constrained Layout
Matplotlib’s constrained layout is an alternative to tight_layout() that can provide better results in some cases, especially for figures with colorbars or legends:
import matplotlib.pyplot as plt
import numpy as np

# Create sample data
x = np.linspace(0, 10, 100)
y1 = np.sin(x)
y2 = np.cos(x)
y3 = np.tan(x)

# Create subplots with constrained layout
fig, (ax1, ax2, ax3) = plt.subplots(3, 1, figsize=(8, 10), constrained_layout=True)

# Plot data
im1 = ax1.imshow(np.outer(y1, y1), cmap='viridis', aspect='auto', extent=[0, 10, 0, 10])
ax1.set_title('Sine Heatmap - how2matplotlib.com')
fig.colorbar(im1, ax=ax1, label='Intensity')

ax2.plot(x, y2)
ax2.set_title('Cosine Wave - how2matplotlib.com')
ax2.legend(['Cosine'])

ax3.plot(x, y3)
ax3.set_title('Tangent Wave - how2matplotlib.com')
ax3.legend(['Tangent'])

plt.show()
Output:

In this example, we use constrained_layout=True when creating the subplots. This automatically adjusts the spacing to accommodate the colorbar and legends without overlapping.
Handling Spacing in Subplots with Different Sizes
Sometimes, you may need to create subplots with different sizes while still maintaining appropriate spacing. Here’s an example of how to achieve this:
import matplotlib.pyplot as plt
import numpy as np

# Create sample data
x = np.linspace(0, 10, 100)
y1 = np.sin(x)
y2 = np.cos(x)
y3 = np.tan(x)

# Create figure and gridspec
fig = plt.figure(figsize=(12, 8))
gs = fig.add_gridspec(2, 2, width_ratios=[2, 1], height_ratios=[1, 2], wspace=0.3, hspace=0.3)

# Create subplots
ax1 = fig.add_subplot(gs[0, 0])
ax2 = fig.add_subplot(gs[0, 1])
ax3 = fig.add_subplot(gs[1, :])

# Plot data
ax1.plot(x, y1)
ax1.set_title('Sine - how2matplotlib.com')

ax2.plot(x, y2)
ax2.set_title('Cosine - how2matplotlib.com')

ax3.plot(x, y3)
ax3.set_title('Tangent - how2matplotlib.com')

plt.show()
Output:
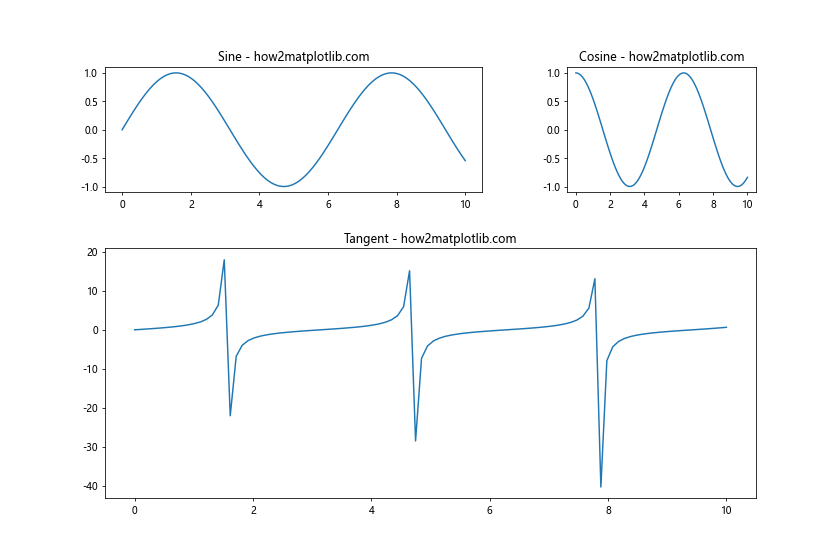
In this example, we use gridspec to create subplots with different sizes. The width_ratios and height_ratios parameters allow us to specify the relative sizes of columns and rows, respectively.
Adjusting Spacing for Subplots with Shared Axes
When creating subplots with shared axes, you may need to adjust the spacing to account for the shared labels. Here’s an example:
import matplotlib.pyplot as plt
import numpy as np

# Create sample data
x = np.linspace(0, 10, 100)
y1 = np.sin(x)
y2 = np.cos(x)
y3 = np.tan(x)

# Create subplots with shared x-axis
fig, (ax1, ax2, ax3) = plt.subplots(3, 1, figsize=(8, 10), sharex=True)

# Plot data
ax1.plot(x, y1)
ax1.set_title('Sine - how2matplotlib.com')

ax2.plot(x, y2)
ax2.set_title('Cosine - how2matplotlib.com')

ax3.plot(x, y3)
ax3.set_title('Tangent - how2matplotlib.com')

# Adjust spacing
plt.subplots_adjust(hspace=0.3)

# Remove x-axis labels for top two subplots
ax1.set_xticklabels([])
ax2.set_xticklabels([])

# Add overall x-axis label
fig.text(0.5, 0.04, 'X-axis', ha='center')

# Add overall y-axis label
fig.text(0.04, 0.5, 'Y-axis', va='center', rotation='vertical')

plt.show()
Output:
In this example, we create subplots with a shared x-axis using sharex=True. We then adjust the spacing using plt.subplots_adjust() and remove the x-axis labels from the top two subplots to avoid redundancy. Finally, we add overall x-axis and y-axis labels using fig.text().
Conclusion
Learning how to set the spacing between subplots in Matplotlib is crucial for creating professional-looking visualizations. Throughout this comprehensive guide, we’ve explored various techniques and best practices for adjusting subplot spacing, including:
- Using
plt.subplots_adjust()for basic spacing control - Utilizing
fig.tight_layout()for automatic spacing adjustment - Employing
gridspecfor advanced layouts - Adjusting individual subplot positions
- Applying best practices for consistent and readable layouts
- Exploring advanced techniques like nested GridSpecs and constrained layout
- Handling spacing for subplots with different sizes and shared axes
By mastering these techniques, you’ll be able to create visually appealing and well-organized plots that effectively communicate your data. Remember to experiment with different spacing options and always consider the overall composition of your figure when adjusting subplot spacing.