How to Set Font Size of Matplotlib Axis Legend
How to set font size of Matplotlib axis Legend is a crucial skill for data visualization enthusiasts and professionals alike. Matplotlib, a powerful plotting library for Python, offers various ways to customize the appearance of your plots, including the font size of the legend. In this comprehensive guide, we’ll explore different methods and techniques to adjust the font size of Matplotlib axis legends, providing you with the knowledge to create visually appealing and informative plots.
Understanding Matplotlib Legends and Font Sizes
Before diving into the specifics of how to set font size of Matplotlib axis Legend, it’s essential to understand what legends are and why font size matters. Legends in Matplotlib are used to label and identify different elements in a plot, such as lines, markers, or patches. The font size of a legend plays a crucial role in the overall readability and aesthetics of your visualization.
When considering how to set font size of Matplotlib axis Legend, keep in mind that the appropriate size depends on various factors, including:
- The overall size of your plot
- The number of legend entries
- The target audience and viewing medium (e.g., screen, print, presentation)
- The desired emphasis on the legend relative to other plot elements
Now, let’s explore different methods to adjust the font size of Matplotlib axis legends.
Method 1: Using the prop Parameter
One of the most straightforward ways to set the font size of Matplotlib axis Legend is by using the prop parameter when creating the legend. This parameter accepts a dictionary of font properties, including the font size.
Here’s a simple example demonstrating how to set font size of Matplotlib axis Legend using the prop parameter:
import matplotlib.pyplot as plt

# Create a simple plot
plt.figure(figsize=(8, 6))
plt.plot([1, 2, 3, 4], [1, 4, 2, 3], label='Line 1')
plt.plot([1, 2, 3, 4], [2, 3, 4, 1], label='Line 2')

# Set the legend font size
plt.legend(prop={'size': 14})

plt.title('How to set font size of Matplotlib axis Legend')
plt.xlabel('X-axis')
plt.ylabel('Y-axis')
plt.text(2, 2, 'how2matplotlib.com', fontsize=12)

plt.show()
Output:
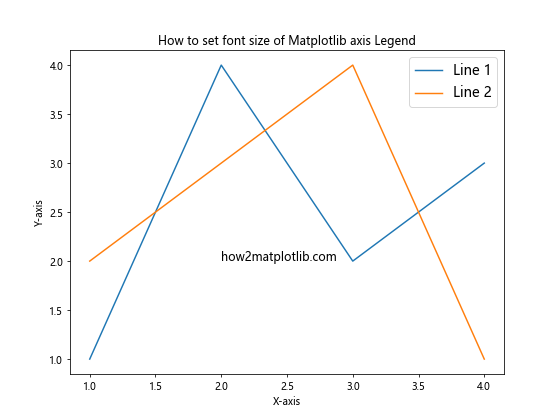
In this example, we’ve set the font size of the legend to 14 points using the prop parameter. This method is simple and effective for quickly adjusting the legend font size.
Method 2: Using rcParams
Another approach to set the font size of Matplotlib axis Legend is by modifying the rcParams dictionary. This method allows you to set a global font size for all legends in your Matplotlib environment.
Here’s an example of how to use rcParams to set the legend font size:
import matplotlib.pyplot as plt

# Set the global legend font size
plt.rcParams['legend.fontsize'] = 12

# Create a simple plot
plt.figure(figsize=(8, 6))
plt.plot([1, 2, 3, 4], [1, 4, 2, 3], label='Line 1')
plt.plot([1, 2, 3, 4], [2, 3, 4, 1], label='Line 2')

plt.legend()

plt.title('How to set font size of Matplotlib axis Legend')
plt.xlabel('X-axis')
plt.ylabel('Y-axis')
plt.text(2, 2, 'how2matplotlib.com', fontsize=12)

plt.show()
Output:
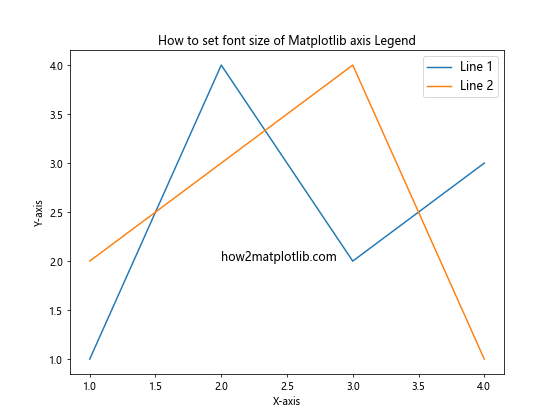
In this example, we’ve set the global legend font size to 12 points using plt.rcParams['legend.fontsize']. This method is useful when you want to maintain a consistent legend font size across multiple plots in your project.
Method 3: Using fontsize Parameter
For those wondering how to set font size of Matplotlib axis Legend in a more direct manner, the fontsize parameter can be used when creating the legend. This parameter allows you to specify the font size directly without using a dictionary.
Here’s an example demonstrating this method:
import matplotlib.pyplot as plt

# Create a simple plot
plt.figure(figsize=(8, 6))
plt.plot([1, 2, 3, 4], [1, 4, 2, 3], label='Line 1')
plt.plot([1, 2, 3, 4], [2, 3, 4, 1], label='Line 2')

# Set the legend font size using the fontsize parameter
plt.legend(fontsize=16)

plt.title('How to set font size of Matplotlib axis Legend')
plt.xlabel('X-axis')
plt.ylabel('Y-axis')
plt.text(2, 2, 'how2matplotlib.com', fontsize=12)

plt.show()
Output:
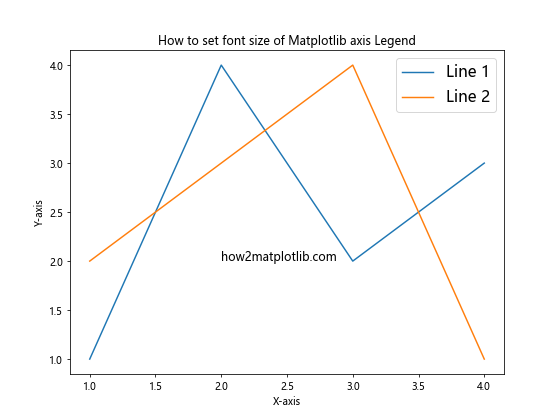
In this example, we’ve set the legend font size to 16 points using the fontsize parameter. This method is straightforward and easy to remember when you need to quickly adjust the legend font size.
Method 4: Using set_* Methods
For more fine-grained control over how to set font size of Matplotlib axis Legend, you can use the set_* methods provided by the Legend object. This approach allows you to modify various properties of the legend, including the font size, after it has been created.
Here’s an example demonstrating this method:
import matplotlib.pyplot as plt

# Create a simple plot
fig, ax = plt.subplots(figsize=(8, 6))
ax.plot([1, 2, 3, 4], [1, 4, 2, 3], label='Line 1')
ax.plot([1, 2, 3, 4], [2, 3, 4, 1], label='Line 2')

# Create the legend
legend = ax.legend()

# Set the font size of the legend text
for text in legend.get_texts():
    text.set_fontsize(14)

ax.set_title('How to set font size of Matplotlib axis Legend')
ax.set_xlabel('X-axis')
ax.set_ylabel('Y-axis')
ax.text(2, 2, 'how2matplotlib.com', fontsize=12)

plt.show()
Output:
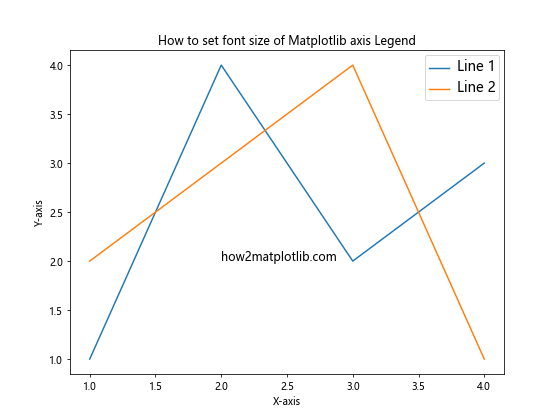
In this example, we’ve used the set_fontsize() method to set the font size of each text element in the legend to 14 points. This method provides more flexibility, allowing you to set different font sizes for individual legend entries if needed.
Method 5: Using plt.setp()
Another approach to set the font size of Matplotlib axis Legend is by using the plt.setp() function. This function allows you to set properties for multiple objects at once, making it useful for adjusting the font size of all legend text elements simultaneously.
Here’s an example demonstrating how to use plt.setp():
import matplotlib.pyplot as plt

# Create a simple plot
fig, ax = plt.subplots(figsize=(8, 6))
ax.plot([1, 2, 3, 4], [1, 4, 2, 3], label='Line 1')
ax.plot([1, 2, 3, 4], [2, 3, 4, 1], label='Line 2')

# Create the legend
legend = ax.legend()

# Set the font size of all legend text elements
plt.setp(legend.get_texts(), fontsize=15)

ax.set_title('How to set font size of Matplotlib axis Legend')
ax.set_xlabel('X-axis')
ax.set_ylabel('Y-axis')
ax.text(2, 2, 'how2matplotlib.com', fontsize=12)

plt.show()
Output:
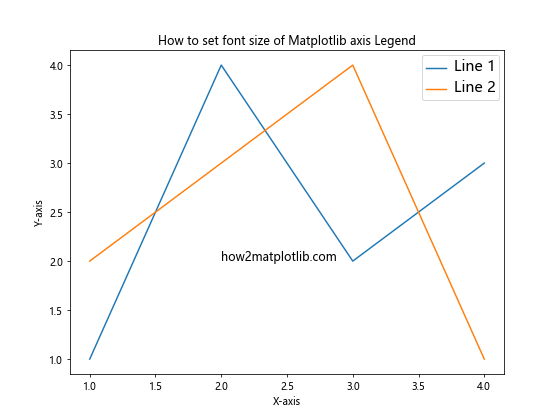
In this example, we’ve used plt.setp() to set the font size of all legend text elements to 15 points. This method is particularly useful when you want to apply the same font size to all legend entries efficiently.
Method 6: Using FontProperties
For those seeking more advanced control over how to set font size of Matplotlib axis Legend, the FontProperties class can be used. This class allows you to create a font configuration object that can be passed to the legend, providing fine-grained control over various font properties, including size.
Here’s an example demonstrating the use of FontProperties:
import matplotlib.pyplot as plt
from matplotlib.font_manager import FontProperties

# Create a simple plot
fig, ax = plt.subplots(figsize=(8, 6))
ax.plot([1, 2, 3, 4], [1, 4, 2, 3], label='Line 1')
ax.plot([1, 2, 3, 4], [2, 3, 4, 1], label='Line 2')

# Create a FontProperties object
font_props = FontProperties(size=13)

# Create the legend with custom font properties
ax.legend(prop=font_props)

ax.set_title('How to set font size of Matplotlib axis Legend')
ax.set_xlabel('X-axis')
ax.set_ylabel('Y-axis')
ax.text(2, 2, 'how2matplotlib.com', fontsize=12)

plt.show()
Output:
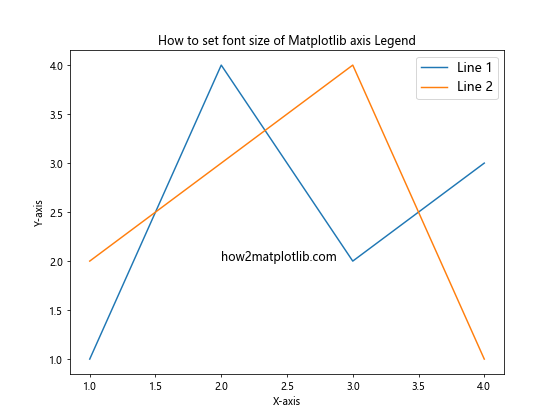
In this example, we’ve created a FontProperties object with a font size of 13 points and passed it to the legend using the prop parameter. This method provides a high level of customization for legend font properties.
Method 7: Using style Context Manager
Matplotlib provides a style context manager that allows you to temporarily set plot styles, including legend font sizes. This method is useful when you want to apply a specific style to a particular plot without affecting the global settings.
Here’s an example of how to use the style context manager to set the legend font size:
import matplotlib.pyplot as plt

# Define a custom style
custom_style = {
    'legend.fontsize': 14,
}

# Create a simple plot with custom style
with plt.style.context(custom_style):
    plt.figure(figsize=(8, 6))
    plt.plot([1, 2, 3, 4], [1, 4, 2, 3], label='Line 1')
    plt.plot([1, 2, 3, 4], [2, 3, 4, 1], label='Line 2')

    plt.legend()

    plt.title('How to set font size of Matplotlib axis Legend')
    plt.xlabel('X-axis')
    plt.ylabel('Y-axis')
    plt.text(2, 2, 'how2matplotlib.com', fontsize=12)

    plt.show()
Output:
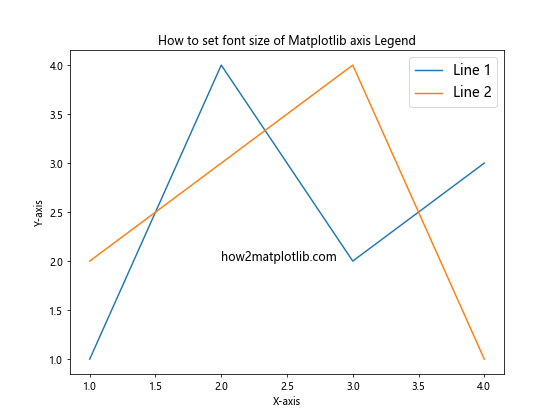
In this example, we’ve defined a custom style dictionary that sets the legend font size to 14 points. By using the plt.style.context() context manager, we apply this style only to the plot created within its scope.
Method 8: Using plt.rc()
The plt.rc() function provides another way to set Matplotlib parameters, including the legend font size. This method allows you to set multiple parameters at once and can be useful for configuring various aspects of your plots.
Here’s an example demonstrating how to use plt.rc() to set the legend font size:
import matplotlib.pyplot as plt

# Set the legend font size using plt.rc()
plt.rc('legend', fontsize=15)

# Create a simple plot
plt.figure(figsize=(8, 6))
plt.plot([1, 2, 3, 4], [1, 4, 2, 3], label='Line 1')
plt.plot([1, 2, 3, 4], [2, 3, 4, 1], label='Line 2')

plt.legend()

plt.title('How to set font size of Matplotlib axis Legend')
plt.xlabel('X-axis')
plt.ylabel('Y-axis')
plt.text(2, 2, 'how2matplotlib.com', fontsize=12)

plt.show()
Output:
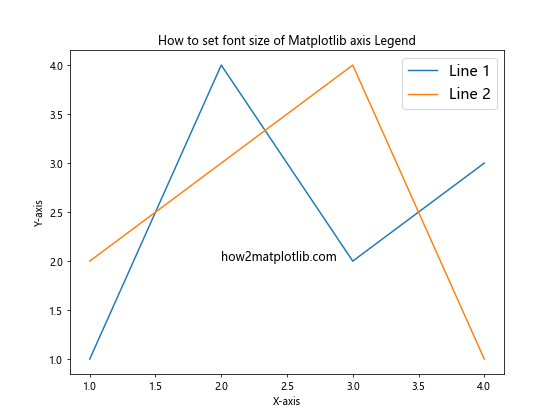
In this example, we’ve used plt.rc('legend', fontsize=15) to set the legend font size to 15 points. This method affects all subsequent plots in the script unless changed later.
Method 9: Using plt.rcdefaults()
When experimenting with different ways to set font size of Matplotlib axis Legend, you might want to reset all rc parameters to their default values. The plt.rcdefaults() function allows you to do this, providing a clean slate for your legend font size adjustments.
Here’s an example demonstrating how to use plt.rcdefaults():
import matplotlib.pyplot as plt

# Set a custom legend font size
plt.rc('legend', fontsize=18)

# Create a plot with the custom font size
plt.figure(figsize=(8, 6))
plt.plot([1, 2, 3, 4], [1, 4, 2, 3], label='Custom Size')
plt.legend()
plt.title('Custom Legend Font Size')
plt.text(2, 2, 'how2matplotlib.com', fontsize=12)
plt.show()

# Reset to default rc parameters
plt.rcdefaults()

# Create a plot with default settings
plt.figure(figsize=(8, 6))
plt.plot([1, 2, 3, 4], [2, 3, 4, 1], label='Default Size')
plt.legend()
plt.title('Default Legend Font Size')
plt.text(2, 2, 'how2matplotlib.com', fontsize=12)
plt.show()
In this example, we first set a custom legend font size, create a plot, then reset to default settings using plt.rcdefaults() before creating another plot. This method is useful when you want to compare different legend font sizes or revert to default settings after making changes.
Method 10: Using plt.style.use()
Matplotlib provides predefined styles that can be used to quickly change the appearance of your plots, including the legend font size. The plt.style.use() function allows you to apply these styles globally or to specific plots.
Here’s an example demonstrating how to use plt.style.use() to set the legend font size:
import matplotlib.pyplot as plt

# Use the 'seaborn' style
plt.style.use('seaborn')

# Create a simple plot
plt.figure(figsize=(8, 6))
plt.plot([1, 2, 3, 4], [1, 4, 2, 3], label='Line 1')
plt.plot([1, 2, 3, 4], [2, 3, 4, 1], label='Line 2')

plt.legend()

plt.title('How to set font size of Matplotlib axis Legend')
plt.xlabel('X-axis')
plt.ylabel('Y-axis')
plt.text(2, 2, 'how2matplotlib.com', fontsize=12)

plt.show()

# Reset to default style
plt.style.use('default')
In this example, we’ve used the ‘seaborn’ style, which affects various plot elements, including the legend font size. After creating the plot, we reset to the default style. This method is useful when you want to quickly apply a consistent style to your plots.
Advanced Techniques for Setting Legend Font Size
Now that we’ve covered the basic methods for how to set font size of Matplotlib axis Legend, let’s explore some advanced techniques that provide even more control and flexibility.
Technique 1: Different Font Sizes for Legend Title and Labels
Sometimes, you may want to set different font sizes for the legend title and the legend labels. Here’s how you can achieve this:
import matplotlib.pyplot as plt

fig, ax = plt.subplots(figsize=(8, 6))
ax.plot([1, 2, 3, 4], [1, 4, 2, 3], label='Line 1')
ax.plot([1, 2, 3, 4], [2, 3, 4, 1], label='Line 2')

legend = ax.legend(title='Legend Title')
legend.get_title().set_fontsize(16)  # Set title font size
for text in legend.get_texts():
    text.set_fontsize(12)  # Set label font size

ax.set_title('How to set font size of Matplotlib axis Legend')
ax.text(2, 2, 'how2matplotlib.com', fontsize=12)

plt.show()
Output:
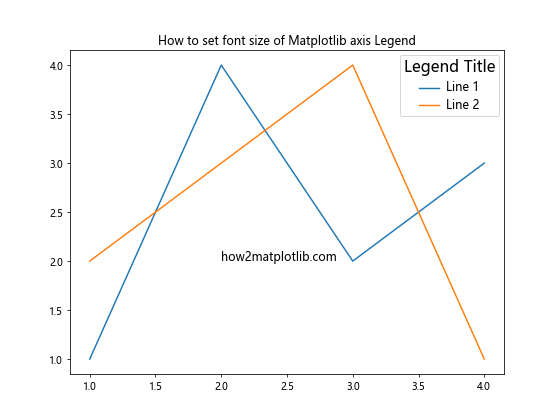
In this exampleIn this example, we’ve set the legend title font size to 16 points and the label font size to 12 points. This technique allows for a clear visual hierarchy within the legend.
Technique 2: Dynamic Font Sizing Based on Figure Size
For responsive legend font sizing, you can calculate the font size based on the figure dimensions. This approach ensures that the legend remains readable across different plot sizes:
import matplotlib.pyplot as plt

def calculate_font_size(fig, base_size=12):
    fig_width, fig_height = fig.get_size_inches()
    fig_area = fig_width * fig_height
    return base_size * (fig_area / 48) ** 0.5

fig, ax = plt.subplots(figsize=(8, 6))
ax.plot([1, 2, 3, 4], [1, 4, 2, 3], label='Line 1')
ax.plot([1, 2, 3, 4], [2, 3, 4, 1], label='Line 2')

font_size = calculate_font_size(fig)
ax.legend(fontsize=font_size)

ax.set_title('How to set font size of Matplotlib axis Legend')
ax.text(2, 2, 'how2matplotlib.com', fontsize=12)

plt.show()
Output:
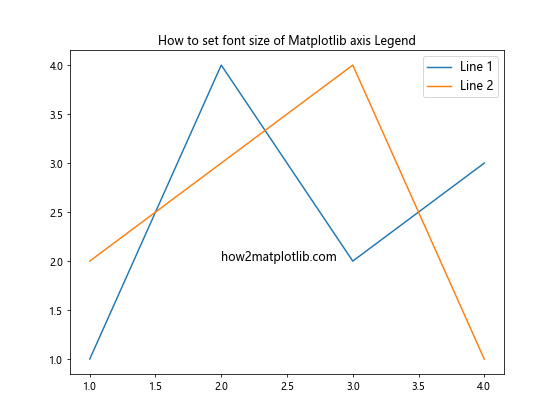
This example demonstrates how to dynamically calculate the legend font size based on the figure dimensions, ensuring that the legend remains proportional to the overall plot size.
Technique 3: Using LaTeX for Legend Text
For publications or presentations requiring high-quality typesetting, you can use LaTeX to render the legend text. This method allows for precise control over the font size and style:
import matplotlib.pyplot as plt
plt.rcParams['text.usetex'] = True
plt.rcParams['font.family'] = 'serif'

fig, ax = plt.subplots(figsize=(8, 6))
ax.plot([1, 2, 3, 4], [1, 4, 2, 3], label=r'$\alpha x + \beta$')
ax.plot([1, 2, 3, 4], [2, 3, 4, 1], label=r'$\gamma x^2 + \delta$')

ax.legend(fontsize=14)

ax.set_title('How to set font size of Matplotlib axis Legend')
ax.text(2, 2, 'how2matplotlib.com', fontsize=12)

plt.show()
In this example, we’ve enabled LaTeX rendering and set the legend font size to 14 points. The labels use LaTeX syntax for mathematical expressions, providing a professional and polished look.
Best Practices for Setting Legend Font Size
When considering how to set font size of Matplotlib axis Legend, it’s important to follow some best practices to ensure your plots are both visually appealing and informative:
- Consistency: Maintain a consistent font size ratio between the legend and other plot elements, such as axis labels and titles.
Readability: Ensure the legend font size is large enough to be easily read, especially when the plot is scaled down or viewed from a distance.
Balance: Strike a balance between the legend size and the plot content. The legend should not overpower or detract from the main visualization.
Responsive Design: Consider using dynamic font sizing techniques for plots that may be displayed at various sizes or on different devices.
Style Guidelines: Adhere to any style guidelines or requirements specific to your field or publication when setting font sizes.
Testing: Always test your plots at different sizes and on various devices to ensure the legend remains readable and well-proportioned.
Troubleshooting Common Issues
When learning how to set font size of Matplotlib axis Legend, you may encounter some common issues. Here are a few problems and their solutions: