Using plt.figure() to Set Title in Matplotlib
In Matplotlib, the plt.figure() function is used to create a new figure. We can use this function to set a title for the figure. In this article, we will explore how to set a title for a figure using plt.figure().
Setting a Title for a Figure
To set a title for a figure in Matplotlib, we can use the plt.figure() function along with the title parameter. Here is an example code snippet that demonstrates how to set a title for a figure:
import matplotlib.pyplot as plt

# Create a new figure
plt.figure()

# Plot a simple line graph
plt.plot([1, 2, 3, 4], [1, 4, 9, 16])

# Set the title for the figure
plt.title('Example Figure Title')

plt.show()
Output:
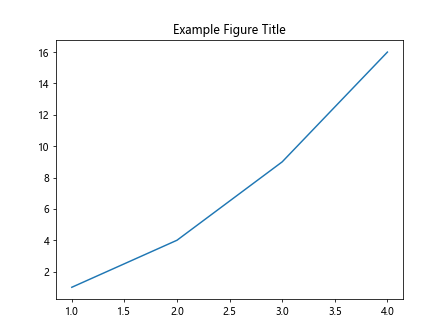
In the above code snippet, we first create a new figure using plt.figure(). We then plot a simple line graph and set the title for the figure using the plt.title() function.
Customizing the Figure Title
We can customize the appearance of the figure title by using additional parameters in the plt.title() function. For example, we can set the font size, font weight, font style, and font color of the title. Here is an example code snippet that demonstrates how to customize the figure title:
import matplotlib.pyplot as plt

# Create a new figure
plt.figure()

# Plot a simple line graph
plt.plot([1, 2, 3, 4], [1, 4, 9, 16])

# Set a custom title with font size, weight, style, and color
plt.title('Customized Figure Title', fontsize=16, fontweight='bold', fontstyle='italic', color='blue')

plt.show()
Output:
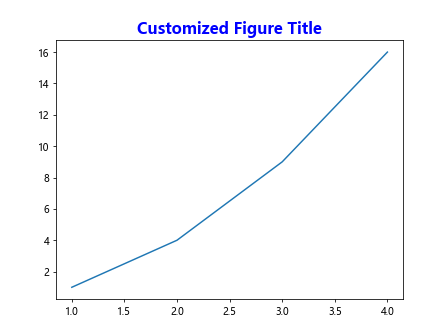
In the above code snippet, we set a custom title for the figure with a font size of 16, bold font weight, italic font style, and blue font color.
Using LaTeX in Figure Title
Matplotlib also supports LaTeX formatting for figure titles. We can use LaTeX syntax to include mathematical symbols, equations, and special characters in the figure title. Here is an example code snippet that demonstrates how to use LaTeX in a figure title:
import matplotlib.pyplot as plt

# Create a new figure
plt.figure()

# Plot a simple line graph
plt.plot([1, 2, 3, 4], [1, 4, 9, 16])

# Set a LaTeX-formatted title
plt.title(r'$\sum_{n=1}^{\infty} \frac{1}{n^2}$')

plt.show()
Output:
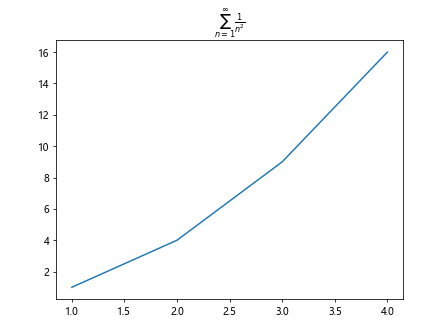
In the above code snippet, we use LaTeX syntax to display the mathematical series for the sum of the reciprocal of squares in the figure title.
Setting a Multiline Title
We can create a multiline title for a figure by using the ‘\n’ newline character in the title string. This allows us to display multiple lines of text in the figure title. Here is an example code snippet that demonstrates how to set a multiline title for a figure:
import matplotlib.pyplot as plt

# Create a new figure
plt.figure()

# Plot a simple line graph
plt.plot([1, 2, 3, 4], [1, 4, 9, 16])

# Set a multiline title
plt.title('Multiline\nFigure\nTitle')

plt.show()
Output:
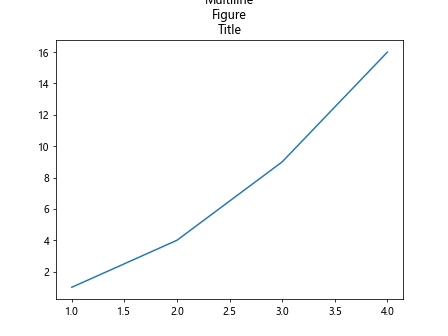
In the above code snippet, we set a multiline title for the figure with three lines of text.
Adding a Subtitle to a Figure
In addition to the main title, we can also add a subtitle to a figure in Matplotlib. We can achieve this by using the plt.suptitle() function to set a subtitle for the figure. Here is an example code snippet that demonstrates how to add a subtitle to a figure:
import matplotlib.pyplot as plt

# Create a new figure
plt.figure()

# Plot a simple line graph
plt.plot([1, 2, 3, 4], [1, 4, 9, 16])

# Set a multiline title
plt.title('Multiline\nFigure\nTitle')
# Add a subtitle to the figure
plt.suptitle('Example Figure Subtitle')

plt.show()
Output:
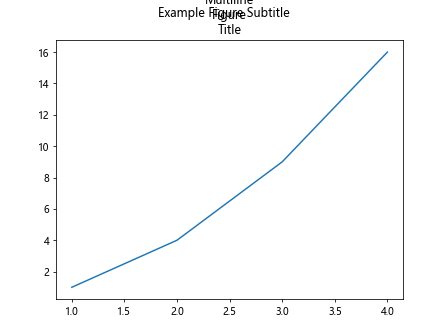
In the above code snippet, we use plt.suptitle() to add a subtitle to the figure.
Using plt.figure() to Set Title in Matplotlib Conclusion
In this article, we have explored how to set a title for a figure in Matplotlib using the plt.figure() function. We have covered how to customize the figure title, use LaTeX formatting, create multiline titles, and add subtitles to figures. By understanding these techniques, you can effectively enhance the visual appearance of your Matplotlib figures. Happy plotting!