Annotate Plt
Matplotlib is a popular Python library used for creating static, animated, and interactive visualizations in Python. One of the useful features in Matplotlib is the ability to annotate plots with text, arrows, and shapes to highlight important points or add supplementary information. In this article, we will explore various ways to annotate a plot in Matplotlib.
Basic Text Annotation
Text annotation is the most straightforward way to add textual information to a plot in Matplotlib. You can specify the text content, position, and text properties such as color, font size, and rotation angle.
import matplotlib.pyplot as plt

plt.figure()
plt.plot([1, 2, 3, 4], [1, 4, 9, 16])
plt.annotate('Max Value', xy=(3, 9), xytext=(2, 10),
             arrowprops=dict(facecolor='black', shrink=0.05))
plt.show()
Output:
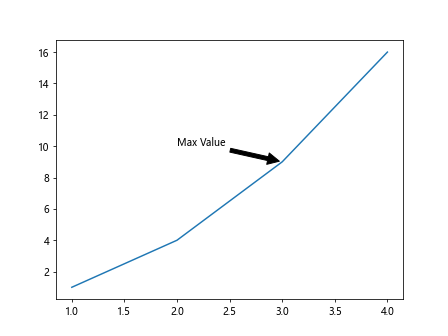
In this example, we plot a simple line graph and annotate the point (3, 9) with the text “Max Value”. The xy parameter specifies the position of the point we want to annotate, and the xytext parameter defines the position of the text with respect to the point.
Arrow Annotation
Arrow annotation in Matplotlib allows us to draw an arrow connecting two points on the plot. We can customize arrow properties such as color, size, and style.
import matplotlib.pyplot as plt

plt.figure()
plt.plot([1, 2, 3, 4], [1, 4, 9, 16])
plt.annotate('Increase', xy=(2, 4), xytext=(1, 6),
             arrowprops=dict(arrowstyle="->", connectionstyle="arc3,rad=.5"))
plt.show()
Output:
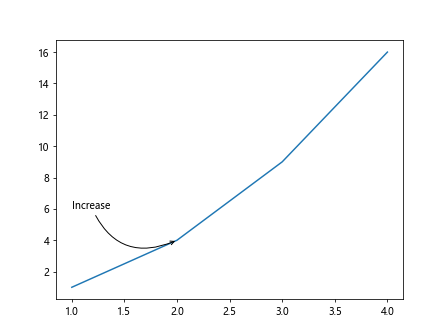
In this example, we annotate the point (2, 4) with the text “Increase” and draw an arrow to point (1, 6). The arrowstyle parameter controls the style of the arrow, and the connectionstyle parameter determines the curvature of the arrow.
Customizing Text Properties
You can customize the text properties such as font size, font weight, color, and rotation angle to make the annotation more visually appealing.
import matplotlib.pyplot as plt

plt.figure()
plt.plot([1, 2, 3, 4], [1, 4, 9, 16])
plt.annotate('Rotate', xy=(3, 9), xytext=(2, 10),
             arrowprops=dict(facecolor='black', shrink=0.05),
             rotation=45, fontsize=12, color='red')
plt.show()
Output:
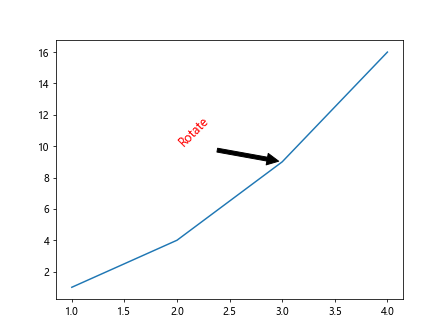
In this example, we customize the annotation text by rotating it 45 degrees, setting the font size to 12, and changing the text color to red.
Annotation with Box
You can annotate a plot using a box around the text to make it stand out. The box properties such as color, edge color, and transparency can be modified.
import matplotlib.pyplot as plt

plt.figure()
plt.plot([1, 2, 3, 4], [1, 4, 9, 16])
plt.annotate('Box Annotation', xy=(3, 9), xytext=(2, 10),
             arrowprops=dict(facecolor='black', shrink=0.05),
             bbox=dict(boxstyle='round,pad=0.5', fc='yellow', ec='blue', alpha=0.5))
plt.show()
Output:
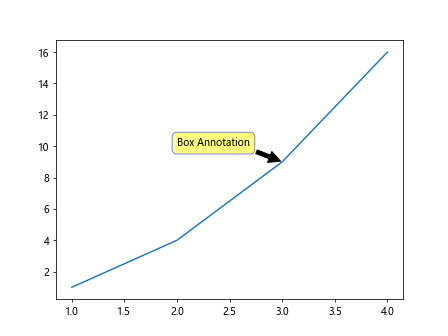
In this example, we add a box around the annotation text “Box Annotation” with a yellow fill color, blue edge color, and 50% transparency.
Multiline Annotation
You can add multiline annotations to your plots by including newline characters (\n) in the text content. This allows you to display multiple lines of text within a single annotation.
import matplotlib.pyplot as plt

plt.figure()
plt.plot([1, 2, 3, 4], [1, 4, 9, 16])
plt.annotate('Multi\nLine\nAnnotation', xy=(3, 9), xytext=(2, 10),
             arrowprops=dict(facecolor='black', shrink=0.05))
plt.show()
Output:
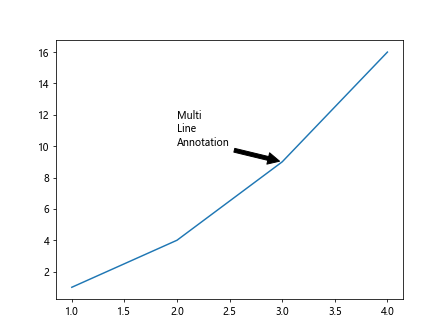
In this example, the text content “Multi\nLine\nAnnotation” will be displayed as three separate lines in the annotation.
Using Arrow Annotations with Different Styles
Matplotlib provides various arrow styles that you can use to create different visual effects in your annotations. Some of the available arrow styles include '->', '|-|', and 'fancy'.
import matplotlib.pyplot as plt

plt.figure()
plt.plot([1, 2, 3, 4], [1, 4, 9, 16])
plt.annotate('Arrow Style', xy=(2, 4), xytext=(1, 6),
             arrowprops=dict(arrowstyle="|-|", connectionstyle="angle,angleA=0,angleB=90,rad=10"))
plt.show()
Output:
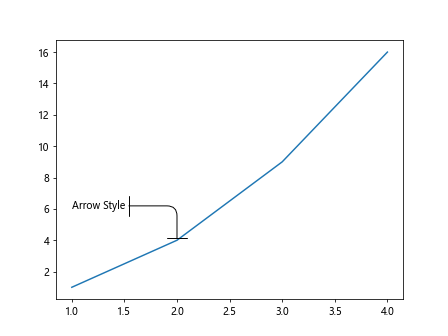
In this example, we use the arrow style '|-|' to draw a double-headed arrow between points (2, 4) and (1, 6).
Annotation with Shape
In addition to text and arrows, you can annotate your plots using shapes such as rectangles, circles, or ellipses. These shapes can be customized with properties like color, transparency, and size.
import matplotlib.pyplot as plt
import matplotlib.patches as mpatches

plt.figure()
plt.plot([1, 2, 3, 4], [1, 4, 9, 16])
rect = mpatches.Rectangle((1.5, 5), 1, 2, linewidth=1, edgecolor='red', facecolor='orange', alpha=0.5)
plt.gca().add_patch(rect)
plt.show()
Output:
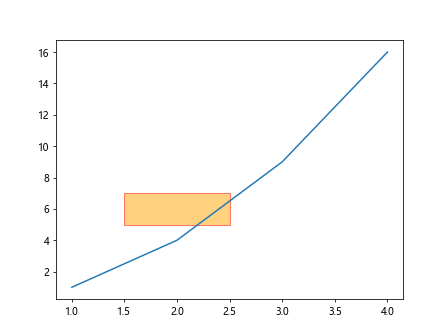
In this example, we draw a rectangular shape at (1.5, 5) with a width of 1 and a height of 2. The rectangle has a red border, an orange fill color, and 50% transparency.
Annotation Without Connecting Arrow
By default, Matplotlib annotations include a connecting arrow that points from the annotation text to the annotated point. If you want to remove this connecting arrow, you can set the arrowstyle property to '-'.
import matplotlib.pyplot as plt

plt.figure()
plt.plot([1, 2, 3, 4], [1, 4, 9, 16])
plt.annotate('No Arrow', xy=(3, 9), xytext=(2, 10),
             arrowprops=dict(arrowstyle="-"))
plt.show()
Output:
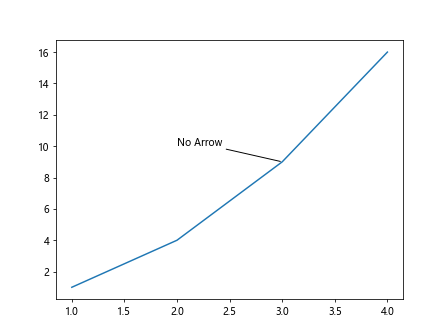
In this example, we annotate the point (3, 9) with the text “No Arrow” without a connecting arrow.
Annotating Multiple Points
You can annotate multiple points on a single plot by iterating over a list of coordinates and texts to create annotations for each point.
import matplotlib.pyplot as plt

points = [(1, 1), (2, 4), (3, 9), (4, 16)]
texts = ['Point A', 'Point B', 'Point C', 'Point D']

plt.figure()
plt.plot([p[0] for p in points], [p[1] for p in points])
for i, point in enumerate(points):
    plt.annotate(texts[i], xy=point, xytext=(point[0] - 1, point[1] + 2),
                 arrowprops=dict(facecolor='black', shrink=0.05))
plt.show()
Output:
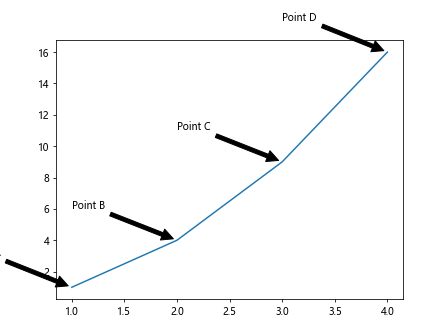
In this example, we annotate multiple points on a plot using a list of coordinates and corresponding text labels.
Annotation with Manual Arrow
If you prefer more control over the appearance of the arrow in your annotation, you can manually draw an arrow using the arrow() function.
import matplotlib.pyplot as plt
import matplotlib.patches as mpatches

plt.figure()
plt.plot([1, 2, 3, 4], [1, 4, 9, 16])
arrow = mpatches.FancyArrowPatch((1, 1), (2, 4), arrowstyle='-|>', mutation_scale=15, color='green')
plt.gca().add_patch(arrow)
plt.show()
Output:
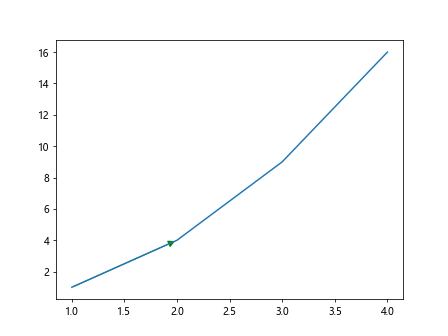
In this example, we manually draw an arrow from point (1, 1) to point (2, 4) with a green color and a custom arrow style.
Customizing Annotation Arrow
You can furthercustomize the appearance of the annotation arrow by modifying properties such as the arrow head style, width, and color.
import matplotlib.pyplot as plt

plt.figure()
plt.plot([1, 2, 3, 4], [1, 4, 9, 16])
plt.annotate('Custom Arrow', xy=(2, 4), xytext=(1, 6),
             arrowprops=dict(arrowstyle="->", linewidth=2, color='purple'))
plt.show()
Output:
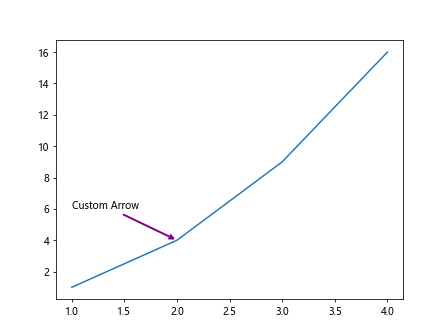
In this example, we customize the annotation arrow by setting the arrow head style to '->', increasing the arrow width to 2, and changing the arrow color to purple.
Annotation with Shadow
To make your annotations stand out more, you can add a shadow effect to the text to create a 3D-like appearance. The shadow properties such as color, offset, and transparency can be customized.
import matplotlib.pyplot as plt

plt.figure()
plt.plot([1, 2, 3, 4], [1, 4, 9, 16])
plt.annotate('Shadow', xy=(3, 9), xytext=(2, 10),
             arrowprops=dict(facecolor='black', shrink=0.05),
             shadow=True, shadow_color='gray', shadow_offset=(2, -2))
plt.show()
In this example, we annotate the point (3, 9) with the text “Shadow” and add a gray shadow offset by (2, -2) to create a 3D shadow effect.
Annotation with Tail
Annotating a plot with a tail allows you to connect the annotation text to a specific point on the plot, creating a visual link between the text and the data point.
import matplotlib.pyplot as plt

plt.figure()
plt.plot([1, 2, 3, 4], [1, 4, 9, 16])
plt.annotate('Tail', xy=(3, 9), xytext=(2, 10),
             arrowprops=dict(arrowstyle="->, tail_width=0.5", connectionstyle="arc3,rad=.5"))
plt.show()
In this example, we use the '->, tail_width=0.5' arrow style to create an arrow with a tail connecting the annotation text to the data point.
Annotation with Background Color
You can add a background color to the annotation text to make it more prominent and visually appealing. The background properties such as color, padding, and transparency can be customized.
import matplotlib.pyplot as plt

plt.figure()
plt.plot([1, 2, 3, 4], [1, 4, 9, 16])
plt.annotate('Background Color', xy=(3, 9), xytext=(2, 10),
             arrowprops=dict(facecolor='black', shrink=0.05),
             bbox=dict(boxstyle="round", fc="cyan", alpha=0.5))
plt.show()
Output:
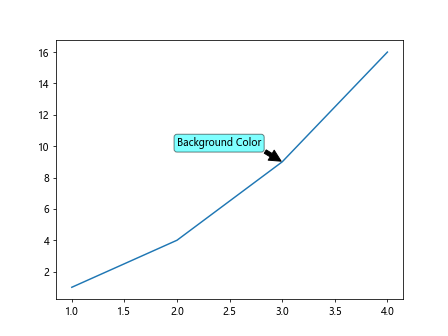
In this example, we annotate the point (3, 9) with the text “Background Color” and add a cyan background with 50% transparency to the annotation text.
Annotation Outside Plot Area
Sometimes, you may want to annotate a point outside the plot area, but still visible within the plot boundaries. You can achieve this by adjusting the annotation text position and using the clip_on property.
import matplotlib.pyplot as plt

plt.figure()
plt.plot([1, 2, 3, 4], [1, 4, 9, 16])
plt.annotate('Outside Plot', xy=(4, 16), xytext=(5, 17),
             annotation_clip=False)
plt.show()
Output:
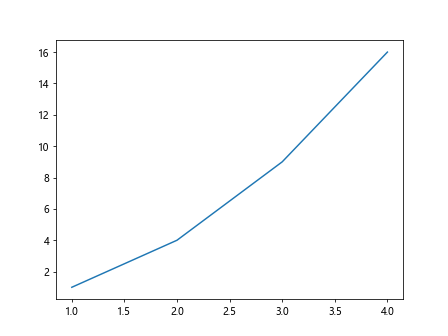
In this example, we annotate the point (4, 16) with the text “Outside Plot” outside the plot area by setting annotation_clip to False.
Annotation with Alpha
By adjusting the alpha value of the annotation text and arrow, you can control the transparency level of the annotation, allowing the underlying plot to show through.
import matplotlib.pyplot as plt

plt.figure()
plt.plot([1, 2, 3, 4], [1, 4, 9, 16])
plt.annotate('Transparent', xy=(3, 9), xytext=(2, 10),
             arrowprops=dict(facecolor='black', shrink=0.05, alpha=0.5),
             alpha=0.5)
plt.show()
Output:
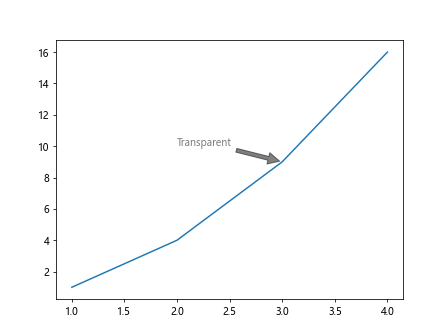
In this example, we set the transparency level of the annotation text and arrow to 0.5 using the alpha property.
Annotation with Callout Box
A callout box is a rectangular box that points to the annotation text, providing a clear visual connection between the annotation and its reference point on the plot.
import matplotlib.pyplot as plt

plt.figure()
plt.plot([1, 2, 3, 4], [1, 4, 9, 16])
plt.annotate('Callout Box', xy=(2, 4), xytext=(1, 6),
             arrowprops=dict(facecolor='black', shrink=0.05),
             bbox=dict(boxstyle="round, pad=0.3", lw=2, fc='yellow', ec='blue'))
plt.show()
Output:
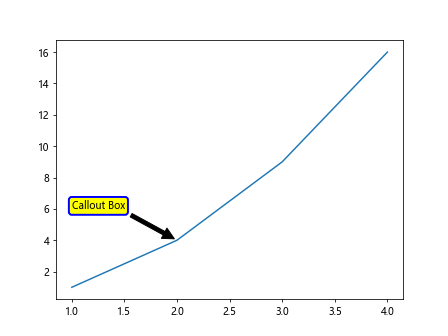
In this example, we annotate the point (2, 4) with the text “Callout Box” using a callout box with a yellow fill color, blue edge color, and padding of 0.3.
Annotate Plt Conclusion
In this article, we explored various ways to annotate plots in Matplotlib using text, arrows, shapes, and customized properties. Annotations are a powerful tool for highlighting important points, adding additional information, and improving the readability of plots. By experimenting with different annotation techniques and properties, you can create visually appealing and informative visualizations in Matplotlib.