Using %matplotlib inline in Jupyter Notebooks
When working with data visualization in Jupyter Notebooks, the magic command %matplotlib inline is a useful tool that allows for the plots to be displayed directly within the notebook. This can be helpful for quickly viewing and analyzing graphs without needing to open an external window.
How to use %matplotlib inline
To use %matplotlib inline, simply include the magic command at the beginning of your Jupyter Notebook. This will ensure that all plots generated using Matplotlib are shown inline.
%matplotlib inline
import matplotlib.pyplot as plt

plt.plot([1, 2, 3, 4])
plt.show()
In the code snippet above, the plot generated by plt.plot([1, 2, 3, 4]) will be displayed directly below the code cell.
Line plots with %matplotlib inline
Line plots are a common type of visualization used to show trends over time or relationships between variables. With %matplotlib inline, we can easily create line plots within Jupyter Notebooks.
import numpy as np
import matplotlib.pyplot as plt

x = np.linspace(0, 10, 100)
y = np.sin(x)

plt.plot(x, y)
plt.xlabel('X-axis')
plt.ylabel('Y-axis')
plt.title('Sine Curve')
plt.show()
Output:
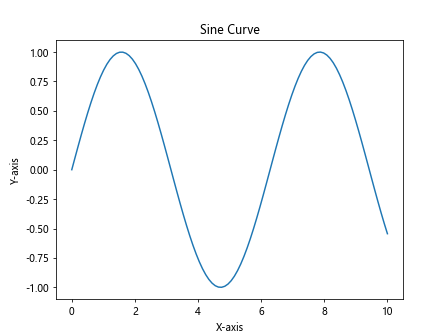
The code above generates a line plot of the sine curve, displaying the relationship between x and y.
Scatter plots with %matplotlib inline
Scatter plots are useful for visualizing the relationship between two variables. With %matplotlib inline, we can create scatter plots directly in our Jupyter Notebook.
import numpy as np
import matplotlib.pyplot as plt

x = np.random.rand(50)
y = np.random.rand(50)
colors = np.random.rand(50)
sizes = 1000 * np.random.rand(50)

plt.scatter(x, y, c=colors, s=sizes, alpha=0.5)
plt.xlabel('X-axis')
plt.ylabel('Y-axis')
plt.title('Scatter Plot')
plt.show()
Output:
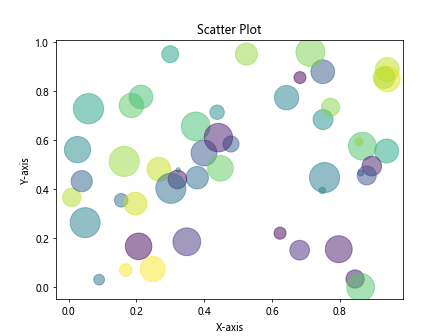
In the code snippet above, we create a scatter plot with random data points, colors, and sizes.
Bar charts with %matplotlib inline
Bar charts are commonly used to compare categories or show the distribution of a variable. With %matplotlib inline, we can easily create bar charts in Jupyter Notebooks.
import numpy as np
import matplotlib.pyplot as plt

x = ['A', 'B', 'C', 'D']
y = [3, 7, 2, 5]

plt.bar(x, y)
plt.xlabel('Categories')
plt.ylabel('Values')
plt.title('Bar Chart')
plt.show()
Output:
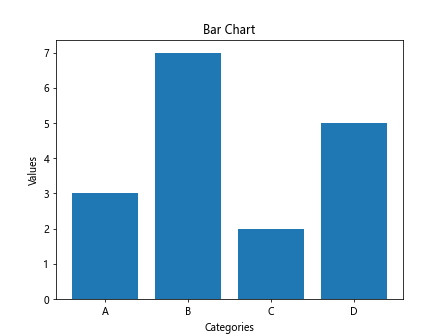
The code above generates a bar chart displaying the values of different categories.
Histograms with %matplotlib inline
Histograms are used to show the distribution of a single numerical variable. With %matplotlib inline, we can create histograms within our Jupyter Notebooks.
import numpy as np
import matplotlib.pyplot as plt

data = np.random.randn(1000)

plt.hist(data, bins=30)
plt.xlabel('Values')
plt.ylabel('Frequency')
plt.title('Histogram')
plt.show()
Output:
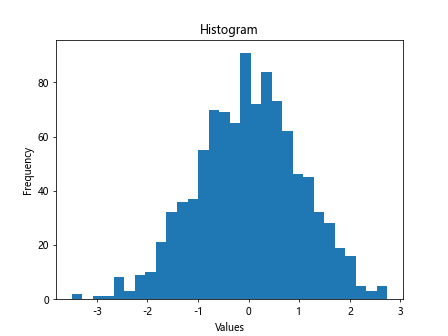
In the code snippet above, we generate a histogram of random data points with 30 bins.
Pie charts with %matplotlib inline
Pie charts are a useful visualization to show the proportional distribution of categories. With %matplotlib inline, we can easily create pie charts in Jupyter Notebooks.
import numpy as np
import matplotlib.pyplot as plt

sizes = [25, 35, 20, 20]
labels = ['A', 'B', 'C', 'D']

plt.pie(sizes, labels=labels, autopct='%1.1f%%')
plt.title('Pie Chart')
plt.show()
Output:
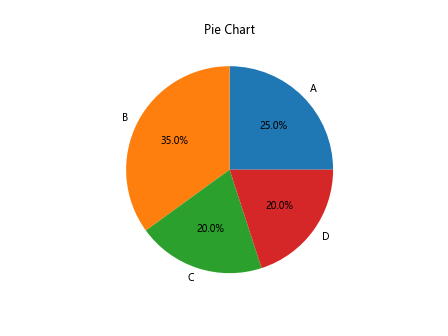
The code above generates a pie chart showing the distribution of values across different categories.
Subplots with %matplotlib inline
Subplots allow us to display multiple plots in a single figure. With %matplotlib inline, we can create subplots in Jupyter Notebooks.
import numpy as np
import matplotlib.pyplot as plt

fig, axs = plt.subplots(2, 2)

x = np.linspace(0, 10, 100)
y1 = np.sin(x)
y2 = np.cos(x)
y3 = np.tan(x)
y4 = np.exp(x)

axs[0, 0].plot(x, y1)
axs[0, 1].plot(x, y2)
axs[1, 0].plot(x, y3)
axs[1, 1].plot(x, y4)

plt.show()
Output:
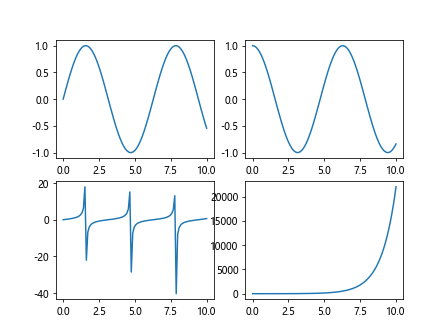
The code above creates a 2×2 subplot layout with different plots displayed in each subplot.
Box plots with %matplotlib inline
Box plots are used to show the distribution of a numerical variable across different categories. With %matplotlib inline, we can create box plots in Jupyter Notebooks.
import numpy as np
import matplotlib.pyplot as plt

data = [np.random.normal(0, std, 100) for std in range(1, 4)]

plt.boxplot(data)
plt.xticks([1, 2, 3], ['A', 'B', 'C'])
plt.ylabel('Values')
plt.title('Box Plot')
plt.show()
Output:
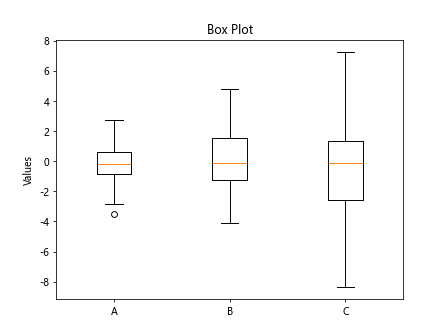
In the code snippet above, we generate a box plot showing the distribution of data across different categories.
Heatmaps with %matplotlib inline
Heatmaps are useful for visualizing matrix data using colors. With %matplotlib inline, we can create heatmaps in Jupyter Notebooks.
import numpy as np
import matplotlib.pyplot as plt

data = np.random.rand(10, 10)

plt.imshow(data, cmap='hot', interpolation='nearest')
plt.colorbar()
plt.title('Heatmap')
plt.show()
Output:
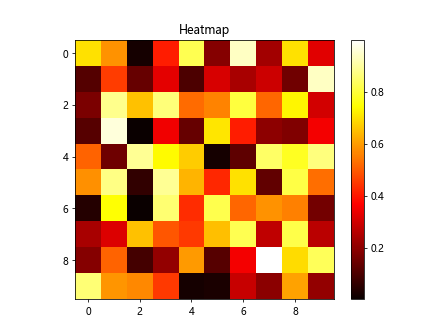
The code above generates a heatmap of random matrix data using the ‘hot’ colormap.
Contour plots with %matplotlib inline
Contour plots are used to show the 3D surface on a 2D plane using contour lines. With %matplotlib inline, we can create contour plots in Jupyter Notebooks.
import numpy as np
import matplotlib.pyplot as plt

x = np.linspace(-2, 2, 100)
y = np.linspace(-2, 2, 100)
X, Y = np.meshgrid(x, y)
Z = np.sin(np.sqrt(X**2 + Y**2))

plt.contour(X, Y, Z, levels=15)
plt.colorbar()
plt.title('Contour Plot')
plt.show()
Output:
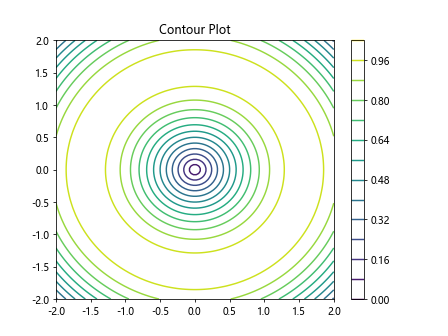
In the code snippet above, we create a contour plot of the sine function using X, Y, and Z meshgrid data.
Error bars with %matplotlib inline
Error bars are used to show the uncertainty or variability of data points. With %matplotlib inline, we can include error bars in our plots in Jupyter Notebooks.
import numpy as np
import matplotlib.pyplot as plt

x = np.arange(0, 10, 1)
y = np.sqrt(x)

errors = np.sqrt(y)

plt.errorbar(x, y, yerr=errors, fmt='o')
plt.xlabel('X-axis')
plt.ylabel('Y-axis')
plt.title('Error Bar Plot')
plt.show()
Output:
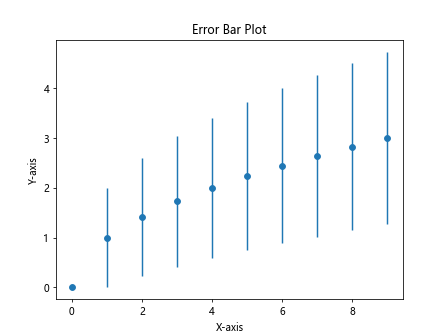
In the code above, error bars are added to the y-values with the corresponding uncertainties.
3D plots with %matplotlib inline
3D plots are useful for visualizing 3D data or relationships. With %matplotlib inline, we can create 3D plots directly in our Jupyter Notebooks.
from mpl_toolkits.mplot3d import Axes3D
import numpy as np
import matplotlib.pyplot as plt

fig = plt.figure()
ax = fig.add_subplot(111, projection='3d')

x = np.linspace(-5, 5, 100)
y = np.linspace(-5, 5, 100)
X, Y = np.meshgrid(x, y)
Z = np.sin(np.sqrt(X**2 + Y**2))

ax.plot_surface(X, Y, Z, cmap='viridis')
plt.title('3D Plot')
plt.show()
The code above generates a 3D surface plot of the sine function using X, Y, and Z meshgrid data.
Customizing plots with %matplotlib inline
You can customize your plots further by adjusting various parameters such as colors, markers, and styles. With %matplotlib inline, you can create customized plots in Jupyter Notebooks.
import numpy as np
import matplotlib.pyplot as plt

x = np.linspace(0, 10, 100)
y = np.sin(x)

plt.plot(x, y, color='blue', linestyle='--', marker='o', markersize=5)
plt.xlabel('X-axis')
plt.ylabel('Y-axis')
plt.title('Customized Plot')
plt.show()
Output:
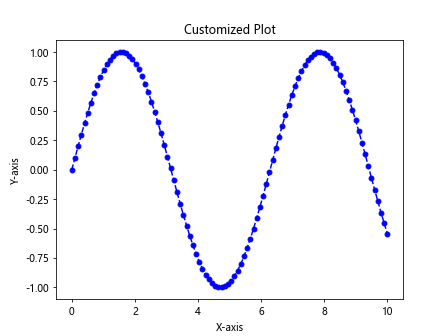
In the code snippet above, we create a customized plot with a blue dashed line, circular markers, and increased markersize.
Saving plots with %matplotlib inline
You can save your plots as image files for later use or sharing with others. With %matplotlib inline, youcan save plots directly from Jupyter Notebooks.
import numpy as np
import matplotlib.pyplot as plt

x = np.linspace(0, 10, 100)
y = np.cos(x)

plt.plot(x, y)
plt.xlabel('X-axis')
plt.ylabel('Y-axis')
plt.title('Cosine Curve')
plt.savefig('cosine_curve.png')
In the code above, the plot of the cosine curve is saved as a PNG image file in the working directory.
Interactive plots with %matplotlib widget
If you prefer interactive plots that allow for zooming, panning, and other interactions, you can use the %matplotlib widget magic command in Jupyter Notebooks. This will enable interactive plotting capabilities.
%matplotlib widget
import matplotlib.pyplot as plt
import numpy as np

x = np.linspace(0, 10, 100)
y = np.sin(x)

plt.plot(x, y)
plt.xlabel('X-axis')
plt.ylabel('Y-axis')
plt.title('Interactive Sine Curve')
plt.show()
In the code snippet above, the plot of the sine curve becomes interactive with zoom and pan functionalities.
%matplotlib.inline Conclusion
In this article, we explored how to use %matplotlib inline in Jupyter Notebooks to display Matplotlib plots directly within the notebook. We covered various types of plots such as line plots, scatter plots, bar charts, histograms, pie charts, subplots, box plots, heatmaps, contour plots, error bars, 3D plots, customized plots, and saving plots. We also discussed how to enable interactive plotting with %matplotlib widget. By utilizing %matplotlib inline, you can streamline your data visualization workflow and easily share your visualizations with others.