Annotate in Matplotlib
Matplotlib is a popular Python library for creating static, animated, and interactive visualizations in Python. One useful feature of Matplotlib is the ability to annotate plots with text, arrows, and shapes to provide additional context and information to the viewer. In this article, we will explore different ways to annotate plots in Matplotlib.
Basic Text Annotations
Text annotations are a simple yet effective way to add labels or descriptions to specific points on a plot. Here is an example of how to create basic text annotations in Matplotlib.
import matplotlib.pyplot as plt

x = [1, 2, 3, 4, 5]
y = [2, 3, 5, 7, 11]

plt.plot(x, y)
plt.annotate('Prime numbers', xy=(3, 5), xytext=(4, 6),
             arrowprops=dict(facecolor='black', shrink=0.05))
plt.show()
Output:
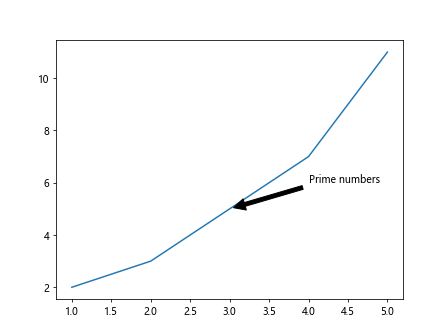
In this example, the annotate function is used to add the text “Prime numbers” to the plot at the point (3, 5) with an arrow pointing to (4, 6).
Annotations with Arrow
Arrows can be added to annotations to visually emphasize the connection between the text and the point on the plot. Here is an example of how to create annotations with arrows in Matplotlib.
import matplotlib.pyplot as plt

x = [1, 2, 3, 4, 5]
y = [2, 3, 5, 7, 11]

plt.plot(x, y)
plt.annotate('How2matplotlib.com', xy=(3, 5), xytext=(4, 6),
             arrowprops=dict(arrowstyle='->', connectionstyle='arc3,rad=.5'))
plt.show()
Output:
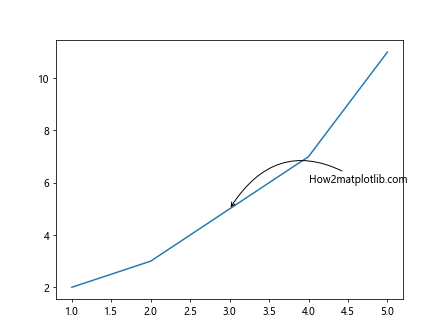
In this example, the arrowstyle parameter is used to specify the style of the arrow, and the connectionstyle parameter is used to control the shape of the arrow connection.
Customizing Annotations
Annotations in Matplotlib can be customized in various ways, such as changing the font size, color, and style of the text. Here is an example of how to customize annotations in Matplotlib.
import matplotlib.pyplot as plt

x = [1, 2, 3, 4, 5]
y = [2, 3, 5, 7, 11]

plt.plot(x, y)
plt.annotate('how2matplotlib.com', xy=(3, 5), xytext=(4, 6),
             arrowprops=dict(arrowstyle='->'),
             fontsize=12, color='red', fontweight='bold')
plt.show()
Output:
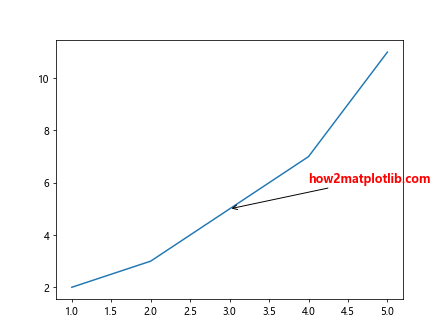
In this example, the fontsize, color, and fontweight parameters are used to customize the appearance of the text in the annotation.
Annotations with Arrowprops
The arrowprops parameter in the annotate function allows for additional customization of the arrow properties, such as the color, width, and style of the arrow. Here is an example of how to use the arrowprops parameter in Matplotlib.
import matplotlib.pyplot as plt

x = [1, 2, 3, 4, 5]
y = [2, 3, 5, 7, 11]

plt.plot(x, y)
plt.annotate('how2matplotlib.com', xy=(3, 5), xytext=(4, 6),
             arrowprops=dict(arrowstyle='->', color='green', linewidth=2))
plt.show()
Output:
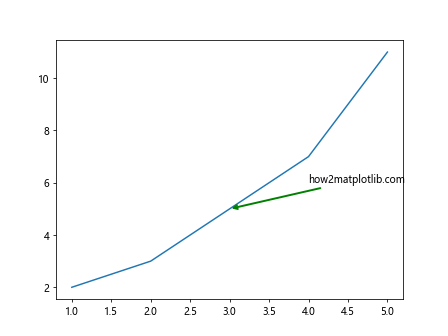
In this example, the color and linewidth parameters in the arrowprops dictionary are used to customize the color and width of the arrow in the annotation.
Annotations with Box
Annotations with boxes can be used to highlight specific areas or points on a plot. Here is an example of how to create annotations with boxes in Matplotlib.
import matplotlib.pyplot as plt

x = [1, 2, 3, 4, 5]
y = [2, 3, 5, 7, 11]

plt.plot(x, y)
plt.annotate('how2matplotlib.com', xy=(3, 5), xytext=(4, 6),
             bbox=dict(boxstyle='round,pad=0.5', fc='yellow', ec='black', lw=2))
plt.show()
Output:
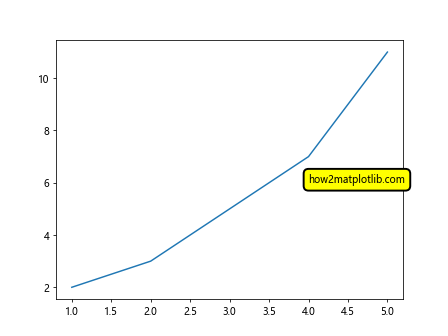
In this example, the bbox parameter is used to specify the box properties, such as the boxstyle, face color (fc), edge color (ec), and linewidth (lw).
Annotations with Shorthand Notation
Matplotlib provides a shorthand notation to create annotations with text only. Here is an example of how to use shorthand notation for annotations in Matplotlib.
import matplotlib.pyplot as plt

x = [1, 2, 3, 4, 5]
y = [2, 3, 5, 7, 11]

plt.plot(x, y)
plt.text(3, 5, 'how2matplotlib.com', fontsize=12, color='blue')
plt.show()
Output:
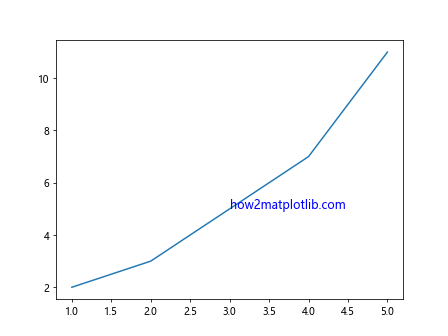
In this example, the text function is used to add text-based annotations to the plot without the need for an arrow or other annotation properties.
Multi-Line Annotations
Multi-line annotations can be used to display multiple lines of text in a single annotation. Here is an example of how to create multi-line annotations in Matplotlib.
import matplotlib.pyplot as plt
from matplotlib.text import OffsetFrom

x = [1, 2, 3, 4, 5]
y = [2, 3, 5, 7, 11]

plt.plot(x, y)
plt.annotate('how2matplotlib.com\nMulti-line annotation', xy=(3, 5), xytext=(4, 6),
             arrowprops=dict(arrowstyle='->'),
             fontsize=12, color='purple')
plt.show()
Output:
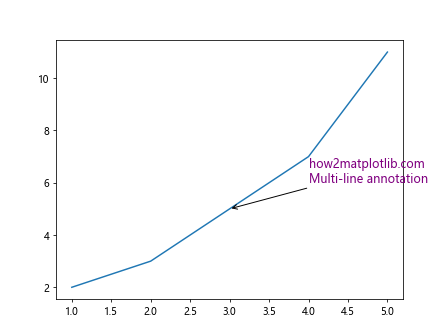
In this example, the \n character is used to create a new line within the text annotation, allowing for multi-line annotations on the plot.
Annotations with User-Specified Arrow
Matplotlib allows for the creation of custom arrows for annotations using the FancyArrowPatch class. Here is an example of how to create annotations with user-specified arrows in Matplotlib.
import matplotlib.pyplot as plt
from matplotlib.patches import FancyArrowPatch

x = [1, 2, 3, 4, 5]
y = [2, 3, 5, 7, 11]

plt.plot(x, y)
arrow = FancyArrowPatch(posA=(3, 5), posB=(4, 6), arrowstyle='-|>',
                        connectionstyle='arc3,rad=.5', mutation_scale=15, lw=2, color='magenta')
plt.gca().add_patch(arrow)
plt.annotate('how2matplotlib.com', xy=(3, 5))
plt.show()
Output:
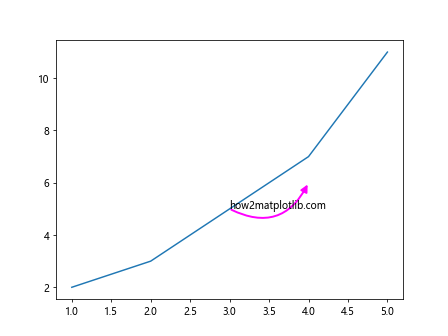
In this example, the FancyArrowPatch class is used to create a custom arrow with the specified arrowstyle, connectionstyle, mutation_scale, linewidth, and color.
Annotations with Text Rotation
Text annotations in Matplotlib can be rotated to any angle to match the orientation of the plot. Here is an example of how to create rotated text annotations in Matplotlib.
import matplotlib.pyplot as plt

x = [1, 2, 3, 4, 5]
y = [2, 3, 5, 7, 11]

plt.plot(x, y)
plt.annotate('how2matplotlib.com', xy=(3, 5), xytext=(4, 6), rotation=45,
             arrowprops=dict(arrowstyle='->'))
plt.show()
Output:
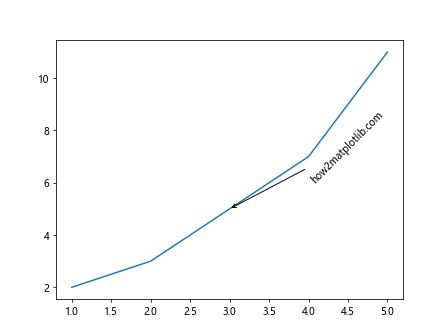
In this example, the rotation parameter is used to specify the angle at which the text annotation should be rotated on the plot.
Annotations with Relative Coordinates
Annotations in Matplotlib can be placed using relative coordinates, which allows for more flexible positioning of annotations on the plot. Here is an example of how to use relative coordinates in annotations in Matplotlib.
import matplotlib.pyplot as plt

x = [1, 2, 3, 4, 5]
y = [2, 3, 5, 7, 11]

plt.plot(x, y)
plt.annotate('how2matplotlib.com', xy=(3, 5), xytext=(0.5, 0.5),
             arrowprops=dict(arrowstyle='->'))
plt.show()
Output:
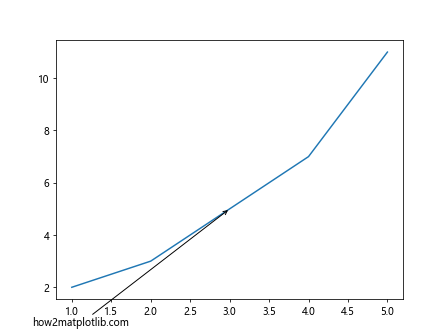
In this example, the xytext parameter is set to (0.5, 0.5) to specify that the text annotation should be placed at 50% of the total plot dimensions in both the x and y directions.
Annotations with Dragging
Matplotlib provides interactive functionality that allows users to drag and move annotations on the plot. Here is an example of how to create annotations with dragging capability in Matplotlib.
import matplotlib.pyplot as plt
from matplotlib.text import DraggableText

x = [1, 2, 3, 4, 5]
y = [2, 3, 5, 7, 11]

plt.plot(x, y)
annotation = plt.annotate('how2matplotlib.com', xy=(3, 5))

draggable_annotation = DraggableText(annotation)
plt.show()
In this example, the DraggableText class from Matplotlib is used to create an annotation with dragging capability, allowing users to interactively move the annotation on the plot.
Annotations with ConnectionStyle
Matplotlib provides various connection styles that can be used to customize the appearance of the arrow connection in annotations. Here is an example of how to use different connection styles in annotations in Matplotlib.
import matplotlib.pyplot as plt

x = [1, 2, 3, 4, 5]
y = [2, 3, 5, 7, 11]

plt.plot(x, y)
plt.annotate('how2matplotlib.com', xy=(3, 5), xytext=(4, 6),
             arrowprops=dict(arrowstyle='->', connectionstyle='arc'),
             fontsize=12, color='green')
plt.show()
Output:
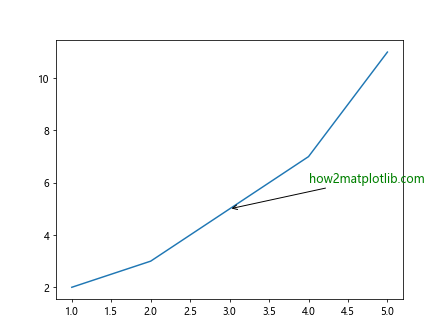
In this example, the connectionstyle parameter is set to 'arc', resulting in an arced connection between the text annotation and the point on the plot.
Annotations with Rotation Mode
Matplotlib provides the ability to set the rotation mode for text annotations, allowing for greater control over the orientation of the text. Here is an example of how to use rotation mode in annotations in Matplotlib.
import matplotlib.pyplot as plt

x = [1, 2, 3, 4, 5]
y = [2, 3, 5, 7, 11]

plt.plot(x, y)
plt.annotate('how2matplotlib.com', xy=(3, 5), xytext=(4, 6),
             arrowprops=dict(arrowstyle='->'),
             rotation_mode='anchor')
plt.show()
Output:
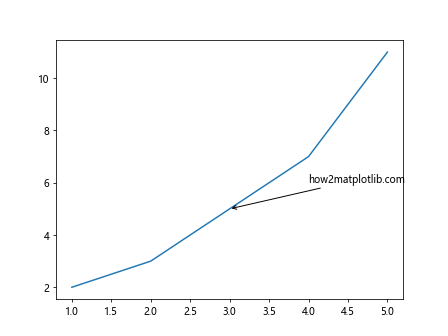
In this example, the rotation_mode parameter is set to ‘anchor’ to ensure that the rotation of the text annotation is anchored at the specified point.
Annotations with Watershed Arrow
Matplotlib provides the AnnotationBbox class, which can be used to create annotations with watershed arrows. Here is an example of how to create annotations with watershed arrows in Matplotlib.
import matplotlib.pyplot as plt
from matplotlib.offsetbox import AnnotationBbox, OffsetImage

x = [1, 2, 3, 4, 5]
y = [2, 3, 5, 7, 11]

fig, ax = plt.subplots()

plt.plot(x, y)
ab = AnnotationBbox(OffsetImage('https://www.how2matplotlib.com/logo.png', zoom=0.1),
                    (3, 5), frameon=False)
ax.add_artist(ab)
plt.show()
In this example, the OffsetImage class is used to add an image to the annotation with a watershed arrow using the AnnotationBbox class.
Annotations with Path Patch
Matplotlib provides the PathPatch class, which can be used to create custom annotations with path patches. Here is an example of how to create annotations with path patches in Matplotlib.
import matplotlib.pyplot as plt
from matplotlib.patches import PathPatch
from matplotlib.path import Path

x = [1, 2, 3, 4, 5]
y = [2, 3, 5, 7, 11]

fig, ax = plt.subplots()

plt.plot(x, y)
path = Path([(0, 0), (2, 1), (1, 2)], [Path.MOVETO, Path.CURVE3, Path.CURVE3])
patch = PathPatch(path, facecolor='green', edgecolor='black', lw=2)
ax.add_patch(patch)
plt.annotate('how2matplotlib.com', xy=(3, 5))
plt.show()
Output:
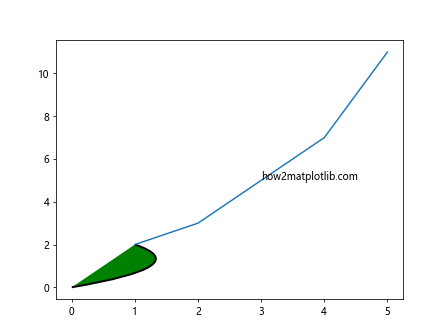
In this example, the Path and PathPatch classes are used to create a custom path for the annotation with face color, edge color, and linewidth specified.
These are just a few examples of the many ways to annotate plots in Matplotlib. By exploring the different annotation methods and customization options, you can add valuable information and context to your visualizations to effectively communicate your data to your audience.