Annotate Arrow in Matplotlib
Matplotlib is a popular data visualization library in Python that allows users to create various types of plots and customize them according to their requirements. One of the features provided by Matplotlib is the ability to annotate arrows on plots. Annotation arrows can be used to highlight specific points or areas on a plot to convey additional information to the audience.
In this article, we will explore how to annotate arrows in Matplotlib with various examples. We will cover the basic usage of annotations, customizing arrow properties, and adding text to annotations.
Basic Annotation Arrow
To annotate an arrow in Matplotlib, we can use the annotate function from the matplotlib.pyplot module. The basic syntax for creating an annotation arrow is as follows:
import matplotlib.pyplot as plt

plt.figure()
plt.annotate('Example Annotation', xy=(0.5, 0.5), xytext=(0.2, 0.8),
             arrowprops=dict(facecolor='black', shrink=0.05))
plt.axis('off')
plt.show()
Output:
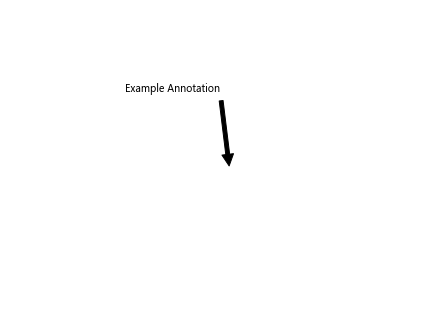
In the above example, we create an annotation arrow with the text ‘Example Annotation’ at the point (0.5, 0.5) on the plot. The xytext parameter specifies the position of the text, and the arrowprops parameter customizes the arrow properties, such as the arrow color and size.
Customizing Arrow Properties
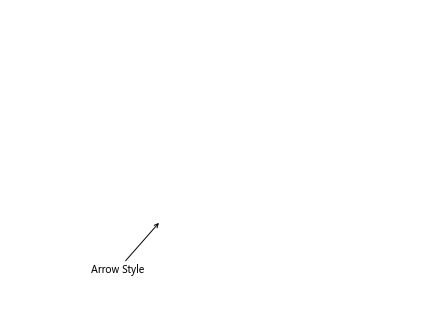
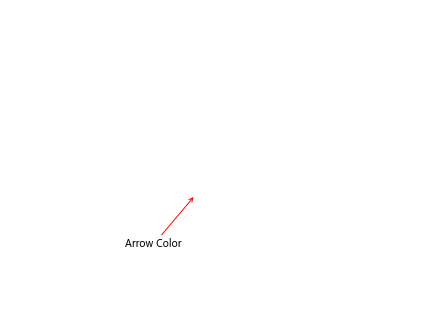
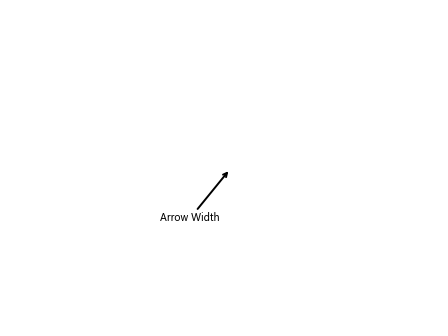
We can customize various properties of the annotation arrow, such as arrow style, color, width, and length. Let’s look at some examples:
Changing Arrow Style
import matplotlib.pyplot as plt

plt.figure()
plt.annotate('Arrow Style', xy=(0.3, 0.3), xytext=(0.1, 0.1),
             arrowprops=dict(arrowstyle='->'))
plt.axis('off')
plt.show()
Output:
Changing Arrow Color
import matplotlib.pyplot as plt

plt.figure()
plt.annotate('Arrow Color', xy=(0.4, 0.4), xytext=(0.2, 0.2),
             arrowprops=dict(arrowstyle='->', color='red'))
plt.axis('off')
plt.show()
Output:
Changing Arrow Width
import matplotlib.pyplot as plt

plt.figure()
plt.annotate('Arrow Width', xy=(0.5, 0.5), xytext=(0.3, 0.3),
             arrowprops=dict(arrowstyle='->', linewidth=2))
plt.axis('off')
plt.show()
Output:
Changing Arrow Length
import matplotlib.pyplot as plt

plt.figure()
plt.annotate('Arrow Length', xy=(0.6, 0.6), xytext=(0.4, 0.4),
             arrowprops=dict(arrowstyle='->', shrink=0.1))
plt.axis('off')
plt.show()
Adding Text to Annotations
We can also add text to annotations to provide more context to the arrow. Let’s see how we can do this:
import matplotlib.pyplot as plt

plt.figure()
plt.annotate('Text with Annotation', xy=(0.7, 0.7), xytext=(0.5, 0.5),
             arrowprops=dict(arrowstyle='->', connectionstyle='arc3,rad=0.3'))
plt.axis('off')
plt.show()
Output:
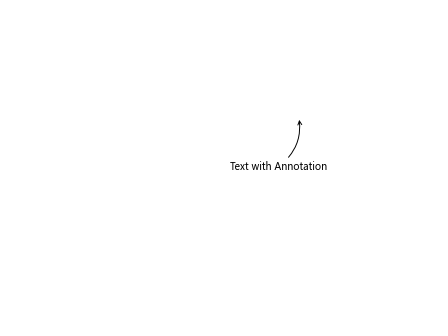
In the above example, we added the text ‘Text with Annotation’ to the annotation arrow and customized the connection style of the arrow using the connectionstyle parameter.
Multiple Annotations
We can add multiple annotations to a single plot by calling the annotate function multiple times. Each call to annotate will create a new annotation arrow on the plot. Let’s create multiple annotations on a plot:
import matplotlib.pyplot as plt

plt.figure()
plt.annotate('Annotation 1', xy=(0.2, 0.2), xytext=(0.1, 0.1),
             arrowprops=dict(arrowstyle='->'))

plt.annotate('Annotation 2', xy=(0.5, 0.5), xytext=(0.3, 0.3),
             arrowprops=dict(arrowstyle='->'))

plt.annotate('Annotation 3', xy=(0.8, 0.8), xytext=(0.6, 0.6),
             arrowprops=dict(arrowstyle='->'))
plt.axis('off')
plt.show()
Output:
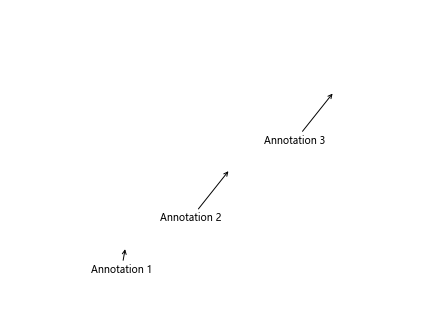
In the above example, we created three annotations on the plot with different text and positions.
Annotate Arrow in Matplotlib Conclusion
In this article, we have explored how to annotate arrows in Matplotlib. We covered the basic usage of annotations, customizing arrow properties, and adding text to annotations. Annotations arrows are a useful tool for highlighting important points on plots and providing additional information to the audience.