Adding a Colorbar in Matplotlib
In Matplotlib, a colorbar is a graphical representation of the mapping between the numerical values in a dataset and the colors displayed in the plot. Colorbars are commonly used in plots such as heatmaps, scatter plots, contour plots, and more to visualize the data distribution and correlation. In this article, we will explore various ways to add colorbars to your Matplotlib plots.
Basic Colorbar
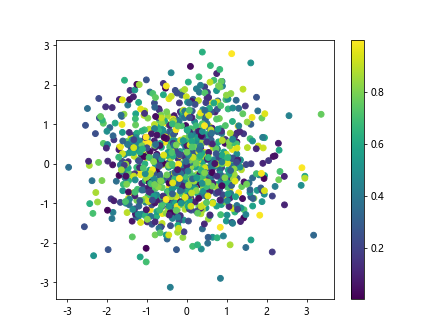
To add a basic colorbar to a plot in Matplotlib, you can use the colorbar method of the plot object. Here is an example of adding a colorbar to a scatter plot:
import matplotlib.pyplot as plt
import numpy as np

x = np.random.randn(1000)
y = np.random.randn(1000)
colors = np.random.rand(1000)

plt.scatter(x, y, c=colors, cmap='viridis')
plt.colorbar()
plt.show()
Output:
Customizing Colorbars
You can customize the colorbar in various ways, such as changing the orientation, location, label, and ticks. Here are some examples of customizing colorbars:
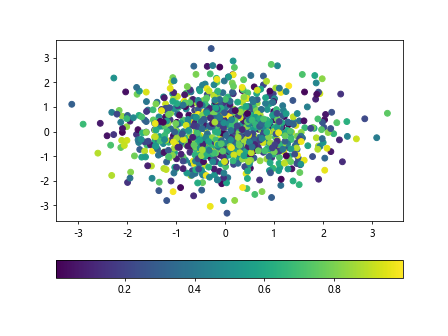
Changing Orientation
import matplotlib.pyplot as plt
import numpy as np

x = np.random.randn(1000)
y = np.random.randn(1000)
colors = np.random.rand(1000)

plt.scatter(x, y, c=colors, cmap='viridis')
plt.colorbar(orientation='horizontal')
plt.show()
Output:
Changing Location
import matplotlib.pyplot as plt
import numpy as np

x = np.random.randn(1000)
y = np.random.randn(1000)
colors = np.random.rand(1000)

plt.scatter(x, y, c=colors, cmap='viridis')
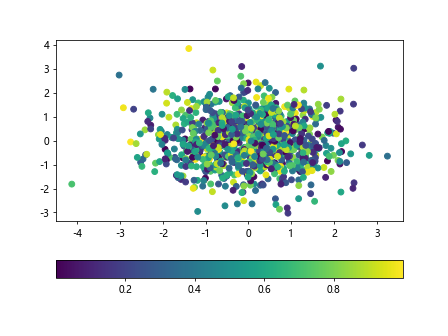
plt.colorbar(location='bottom')
plt.show()
Output:
Adding Label
import matplotlib.pyplot as plt
import numpy as np

x = np.random.randn(1000)
y = np.random.randn(1000)
colors = np.random.rand(1000)

plt.scatter(x, y, c=colors, cmap='viridis')
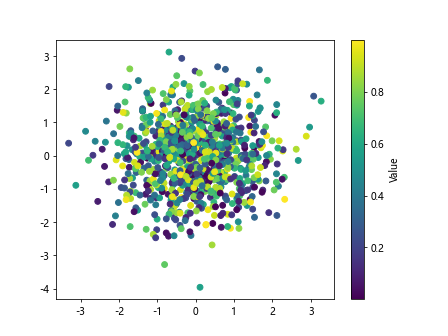
plt.colorbar(label='Value')
plt.show()
Output:
Customizing Ticks
import matplotlib.pyplot as plt
import numpy as np

x = np.random.randn(1000)
y = np.random.randn(1000)
colors = np.random.rand(1000)

plt.scatter(x, y, c=colors, cmap='viridis')
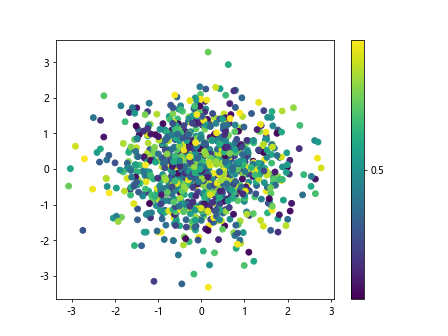
plt.colorbar(ticks=[0, 0.5, 1])
plt.show()
Output:
Colorbar Styles
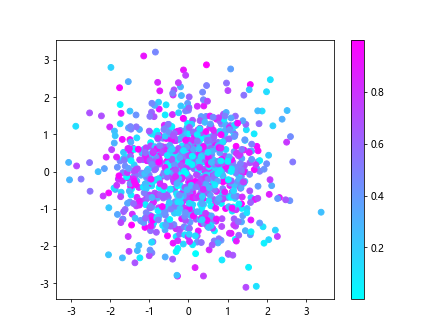
There are several styles of colorbars available in Matplotlib, such as ‘viridis’, ‘plasma’, ‘magma’, ‘inferno’, ‘cool’, ‘hot’, ‘spring’, ‘summer’, ‘autumn’, ‘winter’, ‘gray’, ‘bone’, ‘copper’, ‘jet’, ‘twilight’, and ‘twilight_shifted’. Here is an example of using a different colorbar style:
import matplotlib.pyplot as plt
import numpy as np

x = np.random.randn(1000)
y = np.random.randn(1000)
colors = np.random.rand(1000)

plt.scatter(x, y, c=colors, cmap='cool')
plt.colorbar()
plt.show()
Output:
Logarithmic Colorbar
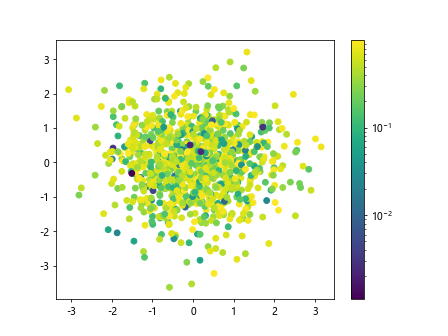
In some cases, it may be useful to have a logarithmic colorbar to better visualize the data distribution. You can achieve this by setting the norm parameter of the colorbar to LogNorm. Here is an example:
from matplotlib.colors import LogNorm
import matplotlib.pyplot as plt
import numpy as np

x = np.random.randn(1000)
y = np.random.randn(1000)
colors = np.random.rand(1000)

plt.scatter(x, y, c=colors, norm=LogNorm())
plt.colorbar()
plt.show()
Output:
Discrete Colorbar
To create a discrete colorbar with a specific number of colors, you can use the ListedColormap from the matplotlib.colors module. Here is an example:
from matplotlib.colors import ListedColormap
import matplotlib.pyplot as plt
import numpy as np

x = np.random.randn(1000)
y = np.random.randn(1000)
colors = plt.cm.plasma(np.linspace(0, 1, 5))
cmap = ListedColormap(colors)

plt.scatter(x, y, c=colors, cmap=cmap)
plt.colorbar()
plt.show()
Colorbar with Specific Range
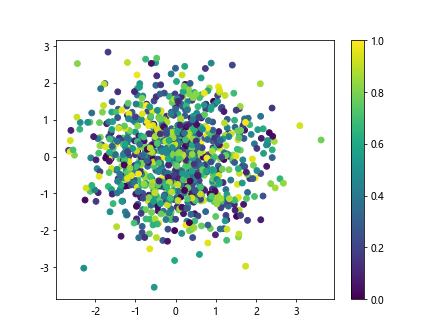
If you want to set a specific range for the colorbar, you can use the vmin and vmax parameters of the colorbar. Here is an example:
import matplotlib.pyplot as plt
import numpy as np

x = np.random.randn(1000)
y = np.random.randn(1000)
colors = np.random.rand(1000)

plt.scatter(x, y, c=colors, cmap='viridis', vmin=0, vmax=1)
plt.colorbar()
plt.show()
Output:
Boundary Colorbar
To create a colorbar with specified boundaries, you can use the BoundaryNorm from the matplotlib.colors module. Here is an example:
from matplotlib.colors import BoundaryNorm
import matplotlib.pyplot as plt
import numpy as np

x = np.random.randn(1000)
y = np.random.randn(1000)
colors = np.random.rand(1000)

bounds = [0, 0.5, 1]
norm = BoundaryNorm(bounds, cmap.N)

plt.scatter(x, y, c=colors, cmap='viridis', norm=norm)
plt.colorbar(ticks=[0, 0.5, 1])
plt.show()
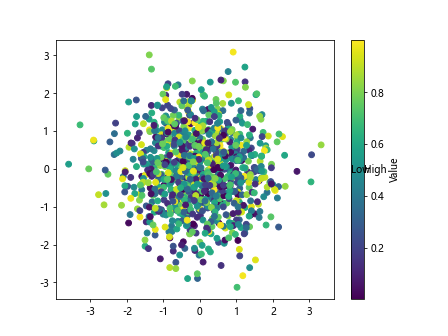
Colorbar with Annotations
You can add annotations to the colorbar to provide additional information about the data being plotted. Here is an example of adding annotations to a colorbar:
import matplotlib.pyplot as plt
import numpy as np

x = np.random.randn(1000)
y = np.random.randn(1000)
colors = np.random.rand(1000)

plt.scatter(x, y, c=colors, cmap='viridis')
cbar = plt.colorbar()
cbar.set_label('Value')
cbar.ax.text(0, 0.5, 'Low', va='center')
cbar.ax.text(1, 0.5, 'High', va='center')
plt.show()
Output:
Colorbar with Tick Labels
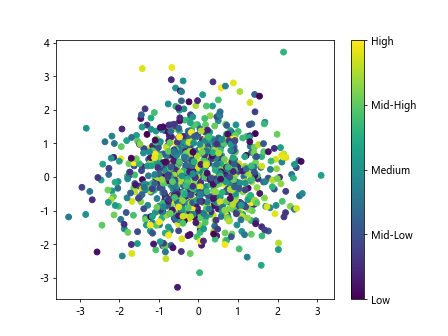
You can customize the tick labels of the colorbar to display specific values or formatting. Here is an example of customizing tick labels in a colorbar:
import matplotlib.pyplot as plt
import numpy as np

x = np.random.randn(1000)
y = np.random.randn(1000)
colors = np.random.rand(1000)

plt.scatter(x, y, c=colors, cmap='viridis')
cbar = plt.colorbar()
cbar.set_ticks([0, 0.25, 0.5, 0.75, 1])
cbar.set_ticklabels(['Low', 'Mid-Low', 'Medium', 'Mid-High', 'High'])
plt.show()
Output:
Colorbar with Gradient
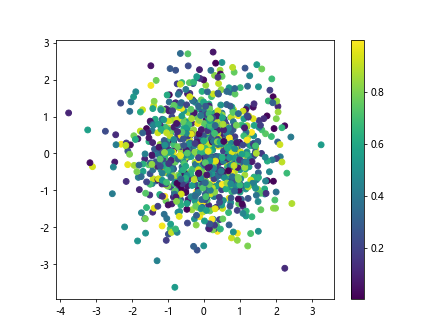
You can create a colorbar with a gradient background to better visualize the mapping between numerical values and colors. Here is an example of adding a gradient background to a colorbar:
import matplotlib.pyplot as plt
import numpy as np

x = np.random.randn(1000)
y = np.random.randn(1000)
colors = np.random.rand(1000)

plt.scatter(x, y, c=colors, cmap='viridis')
cbar = plt.colorbar()
cbar.ax.set_facecolor('lightgray')
plt.show()
Output:
add colorbar matplotlib Conclusion
Adding a colorbar to your Matplotlib plots can enhance the visualization of data distribution and correlation. In this article, we explored various ways of adding and customizing colorbars in Matplotlib, including changing styles, orientations, locations, labels, ticks, and more. By incorporating colorbars in your plots, you can create more informative and visually appealing visualizations.