Introduction to plt.subplot
Overview
plt.subplot is a Matplotlib function that allows us to create multiple subplots within a single figure. This can be useful when we want to compare different plots side by side or visualize multiple sets of data in a clear and organized manner.
In this article, we will explore how to use plt.subplot to create and customize subplots in Matplotlib. We will cover various aspects of plt.subplot, including creating subplots with different configurations, setting titles and labels, adjusting spacing, and more.
Let’s dive in and see how we can make the most out of plt.subplot!
Basic Usage
The basic syntax for creating subplots with plt.subplot is plt.subplot(nrows, ncols, index). Here, nrows and ncols specify the number of rows and columns in the subplot grid, while index specifies the position of the subplot in the grid.
Let’s start with a simple example to create a 2×2 grid of subplots:
import matplotlib.pyplot as plt

# Create a 2x2 grid of subplots
plt.subplot(2, 2, 1)
plt.plot([1, 2, 3, 4], [1, 4, 9, 16])

plt.subplot(2, 2, 2)
plt.plot([1, 2, 3, 4], [1, 2, 3, 4])

plt.subplot(2, 2, 3)
plt.plot([1, 2, 3, 4], [4, 3, 2, 1])

plt.subplot(2, 2, 4)
plt.plot([1, 2, 3, 4], [8, 6, 4, 2])

plt.show()
Output:
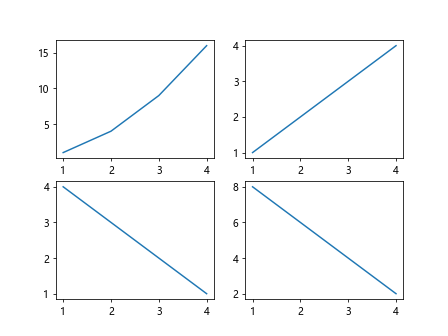
In this example, we create a 2×2 grid of subplots and plot different datasets in each subplot.
Customizing Subplots
Once we have created subplots, we can customize them by setting titles, labels, colors, styles, and more. Let’s look at a few examples of how to customize subplots in Matplotlib.
Setting Titles and Labels
We can set titles and labels for subplots using plt.title, plt.xlabel, and plt.ylabel.
import matplotlib.pyplot as plt

# Create a 2x1 grid of subplots
plt.subplot(2, 1, 1)
plt.plot([1, 2, 3, 4], [1, 4, 9, 16])
plt.title('Subplot 1')
plt.xlabel('X-axis')
plt.ylabel('Y-axis')

plt.subplot(2, 1, 2)
plt.plot([1, 2, 3, 4], [1, 2, 3, 4])
plt.title('Subplot 2')
plt.xlabel('X-axis')
plt.ylabel('Y-axis')

plt.show()
Output:
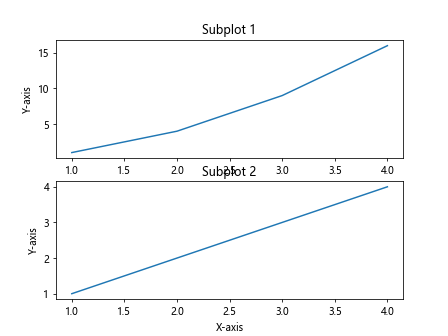
In this example, we create a 2×1 grid of subplots and set titles, x-axis labels, and y-axis labels for each subplot.
Adjusting Spacing
We can adjust the spacing between subplots using plt.subplots_adjust.
import matplotlib.pyplot as plt

# Create a 2x1 grid of subplots
plt.subplot(2, 1, 1)
plt.plot([1, 2, 3, 4], [1, 4, 9, 16])
plt.title('Subplot 1')

plt.subplot(2, 1, 2)
plt.plot([1, 2, 3, 4], [1, 2, 3, 4])
plt.title('Subplot 2')

plt.subplots_adjust(hspace=0.5)

plt.show()
Output:
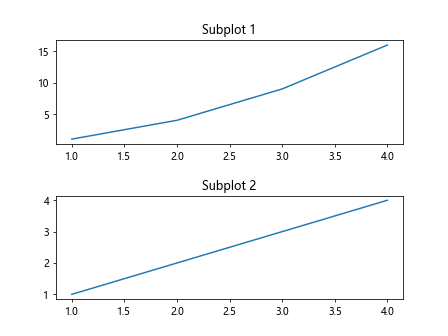
In this example, we create a 2×1 grid of subplots and adjust the vertical spacing between them using plt.subplots_adjust.
Creating Complex Layouts
We can create more complex layouts by combining different configurations of subplots. Let’s look at a few examples of creating complex layouts in Matplotlib.
Creating a Grid of Subplots
We can create a grid of subplots with different configurations using plt.subplot2grid.
import matplotlib.pyplot as plt

# Create a 3x3 grid of subplots
plt.subplot2grid((3, 3), (0, 0), colspan=3)
plt.plot([1, 2, 3, 4], [1, 4, 9, 16])

plt.subplot2grid((3, 3), (1, 0), colspan=2)
plt.plot([1, 2, 3, 4], [1, 2, 3, 4])

plt.subplot2grid((3, 3), (1, 2), rowspan=2)
plt.plot([1, 2, 3, 4], [4, 3, 2, 1])

plt.subplot2grid((3, 3), (2, 0))
plt.plot([1, 2, 3, 4], [1, 4, 9, 16])

plt.subplot2grid((3, 3), (2, 1))
plt.plot([1, 2, 3, 4], [1, 2, 3, 4])

plt.show()
Output:
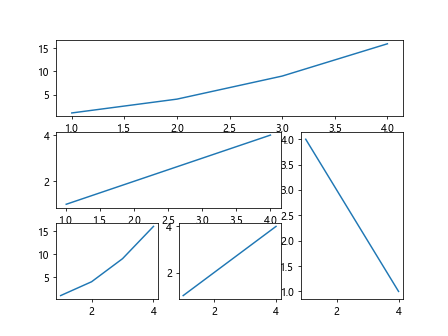
In this example, we create a 3×3 grid of subplots with different configurations using plt.subplot2grid.
Creating a Complex Layout
We can create a complex layout with multiple rows and columns of subplots using plt.subplot.
import matplotlib.pyplot as plt

# Create a complex layout of subplots
plt.subplot(4, 3, 1)
plt.plot([1, 2, 3, 4], [1, 4, 9, 16])

plt.subplot(4, 3, 2)
plt.plot([1, 2, 3, 4], [1, 2, 3, 4])

plt.subplot(4, 3, 3)
plt.plot([1, 2, 3, 4], [4, 3, 2, 1])

plt.subplot(4, 3, 4)
plt.plot([1, 2, 3, 4], [8, 6, 4, 2])

# Add more subplots here

plt.show()
Output:
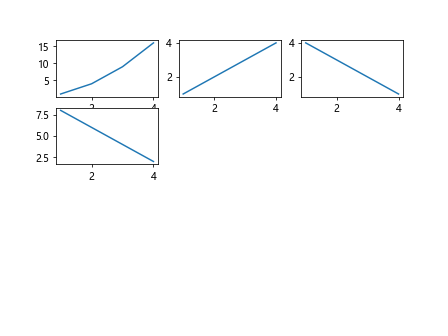
In this example, we create a complex layout with multiple rows and columns of subplots using plt.subplot. We can add more subplots by specifying the position and configuration.
Introduction to plt.subplot Conclusion
In this article, we have explored how to use plt.subplot to create and customize subplots in Matplotlib. We have covered basic usage, customizing subplots, creating complex layouts, and more.
By mastering plt.subplot, we can effectively visualize multiple sets of data in a clear and organized manner. Experiment with different configurations and settings to create visually appealing subplots in Matplotlib.
Start creating your own subplots with plt.subplot today and elevate your data visualization skills!