Plt Savefig DPI
When using Matplotlib to create visualizations, you may want to save the figures you create as image files. Matplotlib provides the savefig() function for this purpose. One important parameter of this function is dpi, which stands for dots per inch. In this article, we will explore how to use the dpi parameter in the savefig() function to control the resolution of the saved images.
Understanding DPI
DPI refers to the number of dots (or pixels) that fit into one inch of a printed image. The higher the DPI, the more detailed and higher quality the image will be. When saving figures using Matplotlib, adjusting the DPI can be useful if you want to produce high-resolution images for printing or publication.
Let’s start by creating a simple plot using Matplotlib and saving it with different DPI settings.
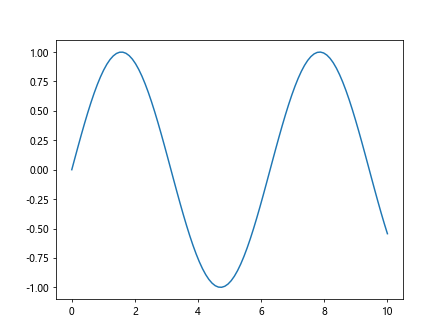
import matplotlib.pyplot as plt
import numpy as np

x = np.linspace(0, 10, 100)
y = np.sin(x)

plt.plot(x, y)
plt.savefig('fig_dpi_80.png', dpi=80)
plt.savefig('fig_dpi_120.png', dpi=120)
plt.show()
Output:

In the code above, we first create a simple sine wave plot using NumPy and Matplotlib. We then use the savefig() function to save the plot as two different image files with DPI settings of 80 and 120, respectively.
DPI and Image Quality
Higher DPI values generally result in higher image quality and larger file sizes. Let’s compare the image quality at different DPI settings by saving the same plot with varying DPI values.
import matplotlib.pyplot as plt
import numpy as np

x = np.linspace(0, 10, 100)
y = np.sin(x)

plt.plot(x, y)
plt.savefig('fig_dpi_80.png', dpi=80)
plt.savefig('fig_dpi_120.png', dpi=120)
plt.savefig('fig_dpi_200.png', dpi=200)
plt.savefig('fig_dpi_300.png', dpi=300)
plt.show()
Output:

In the code snippet above, we save the same plot with DPI settings of 80, 120, 200, and 300. You can compare the image quality of the saved files by zooming in to see the level of detail.
Resizing Images with DPI
Apart from image quality, DPI can also affect the size of the saved image. Let’s explore how changing the DPI value impacts the size of the saved image.
import matplotlib.pyplot as plt
import numpy as np

x = np.linspace(0, 10, 100)
y = np.sin(x)

plt.plot(x, y)
plt.savefig('fig_dpi_80.png', dpi=80)
plt.savefig('fig_dpi_160.png', dpi=160)
plt.savefig('fig_dpi_320.png', dpi=320)
plt.savefig('fig_dpi_640.png', dpi=640)
plt.show()
Output:

In the code snippet above, we save the plot with increasing DPI settings of 80, 160, 320, and 640. You will notice that as the DPI value increases, the size of the saved image also increases.
DPI and Printing
One common use case for adjusting DPI when saving figures is to prepare images for printing. Printers typically require images with a higher DPI to ensure that the printed output looks crisp and clear. Let’s save a plot with a DPI suitable for printing.
import matplotlib.pyplot as plt
import numpy as np

x = np.linspace(0, 10, 100)
y = np.sin(x)

plt.plot(x, y)
plt.savefig('fig_for_printing.png', dpi=300)
plt.show()
Output:
In the code above, we save the plot with a DPI setting of 300, which is suitable for printing purposes. You can then easily print the saved image without worrying about losing image quality.
Customizing DPI for Specific Needs
Depending on your specific requirements, you may need to adjust the DPI value when saving figures. For example, if you are creating images for web use or social media, you may want to use a lower DPI to reduce file size without compromising too much on image quality.
Let’s save a plot with a lower DPI setting suitable for web use.
import matplotlib.pyplot as plt
import numpy as np

x = np.linspace(0, 10, 100)
y = np.sin(x)

plt.plot(x, y)
plt.savefig('fig_for_web.png', dpi=72)
plt.show()
Output:

In the code snippet above, we save the plot with a DPI setting of 72, which is commonly used for web and digital display purposes. This ensures that the image is optimized for online viewing.
Conclusion
In this article, we have explored how to use the dpi parameter in the savefig() function in Matplotlib to control the resolution of saved images. By understanding the concept of DPI and experimenting with different DPI settings, you can optimize the quality and size of your saved figures based on your specific requirements. Whether you are preparing images for printing, digital display, or publication, adjusting the DPI can help you achieve the desired results. Experiment with different DPI values to find the optimal settings for your needs.