plt fill between
The plt.fill_between() function in Matplotlib is used to fill the area between two vertical curves. This can be useful for highlighting a specific region in a plot or showing the uncertainty in data.
Basic Usage
To illustrate the basic usage of plt.fill_between(), consider the following example:
import matplotlib.pyplot as plt
import numpy as np

x = np.linspace(0, 10, 100)
y1 = np.sin(x)
y2 = np.cos(x)

plt.plot(x, y1, color='blue')
plt.plot(x, y2, color='red')

plt.fill_between(x, y1, y2, color='grey', alpha=0.5)

plt.show()
Output:
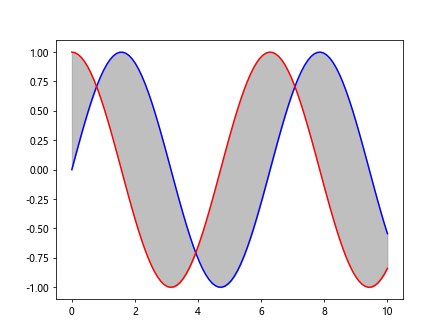
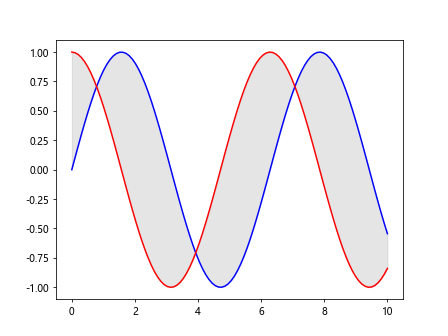
In this example, we have two curves y1 and y2 plotted against x. We then use plt.fill_between() to fill the area between these two curves with a grey color.
Filling Area Below a Curve
You can also fill the area below a curve by setting the y2 parameter to a constant value. Here is an example:
import matplotlib.pyplot as plt
import numpy as np

x = np.linspace(0, 10, 100)
y = np.sin(x)

plt.plot(x, y, color='green')
plt.fill_between(x, y, 0, color='yellow', alpha=0.5)

plt.show()
Output:
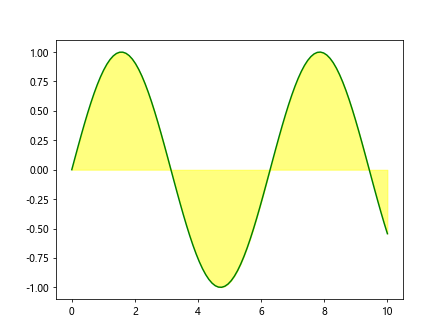
In this example, we plot the curve y = sin(x) and fill the area below it with a yellow color.
Multiple Fills
You can fill multiple regions in a plot by calling plt.fill_between() multiple times. Here is an example:
import matplotlib.pyplot as plt
import numpy as np

x = np.linspace(0, 10, 100)
y1 = np.sin(x)
y2 = np.cos(x)

plt.plot(x, y1, color='blue')
plt.plot(x, y2, color='red')

plt.fill_between(x, y1, y2, where=(y1 > y2), color='grey', alpha=0.5)
plt.fill_between(x, y1, y2, where=(y1 <= y2), color='orange', alpha=0.5)

plt.show()
Output:
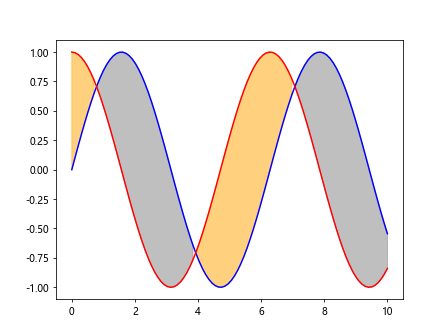
In this example, we fill the area between the curves y1 and y2 with different colors based on the condition.
Customizing Fill Styles
You can customize the fill styles using the interpolate parameter. Here is an example:
import matplotlib.pyplot as plt
import numpy as np

x = np.linspace(0, 10, 100)
y1 = np.sin(x)
y2 = np.cos(x)

plt.plot(x, y1, color='blue')
plt.plot(x, y2, color='red')

plt.fill_between(x, y1, y2, where=(y1 > y2), interpolate=True, color='purple', alpha=0.5)
plt.fill_between(x, y1, y2, where=(y1 <= y2), interpolate=True, color='pink', alpha=0.5)

plt.show()
Output:
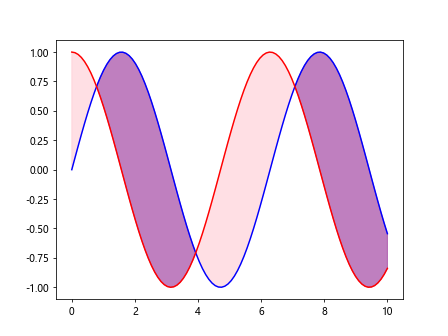
In this example, we set the interpolate parameter to True to fill the areas between the curves with a smooth transition.
Hatching
You can also add hatching to the filled area using the hatch parameter. Here is an example:
import matplotlib.pyplot as plt
import numpy as np

x = np.linspace(0, 10, 100)
y1 = np.sin(x)
y2 = np.cos(x)

plt.plot(x, y1, color='blue')
plt.plot(x, y2, color='red')

plt.fill_between(x, y1, y2, where=(y1 > y2), hatch='/', color='cyan', alpha=0.5)
plt.fill_between(x, y1, y2, where=(y1 <= y2), hatch='.', color='magenta', alpha=0.5)

plt.show()
Output:
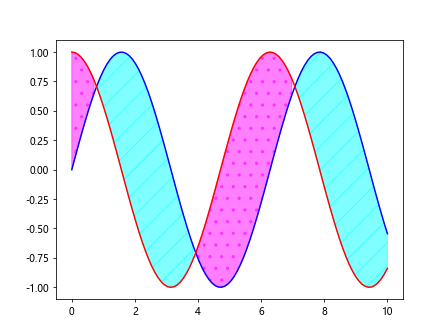
In this example, we add hatching to the filled areas between the curves with different styles.
Stacked Fills
You can also stack filled areas on top of each other by specifying the stacked parameter. Here is an example:
import matplotlib.pyplot as plt
import numpy as np

x = np.linspace(0, 10, 100)
y1 = np.sin(x)
y2 = np.cos(x)
y3 = np.tan(x)

plt.plot(x, y1, color='blue')
plt.plot(x, y2, color='red')

plt.fill_between(x, y1, y2, color='grey', alpha=0.5, stacked=True)
plt.fill_between(x, y2, y3, color='orange', alpha=0.5, stacked=True)

plt.show()
In this example, we stack filled areas between different pairs of curves on top of each other.
Transparent Fills
You can adjust the transparency of the filled area using the alpha parameter. Here is an example:
import matplotlib.pyplot as plt
import numpy as np

x = np.linspace(0, 10, 100)
y1 = np.sin(x)
y2 = np.cos(x)

plt.plot(x, y1, color='blue')
plt.plot(x, y2, color='red')

plt.fill_between(x, y1, y2, color='grey', alpha=0.2)

plt.show()
Output:
In this example, we set the transparency of the filled area to 0.2 using the alpha parameter.
Filling Between Vertical Lines
You can also fill the area between two vertical lines by specifying the x coordinates. Here is an example:
import matplotlib.pyplot as plt
import numpy as np

x = np.linspace(0, 10, 100)
y = np.sin(x)

plt.plot(x, y, color='green')

plt.fill_betweenx(y, 2, 4, color='blue', alpha=0.5)

plt.show()
Output:
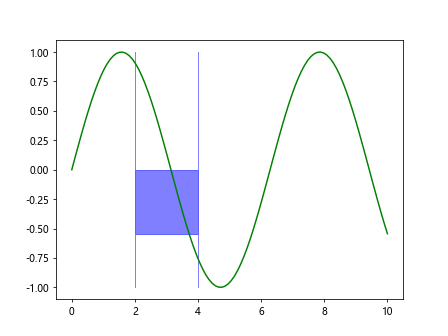
In this example, we plot the curve y = sin(x) and fill the area between the vertical lines at x = 2 and x = 4 with a blue color.
Filling Between Horizontal Lines
Similarly, you can fill the area between two horizontal lines by specifying the y coordinates. Here is an example:
import matplotlib.pyplot as plt
import numpy as np

x = np.linspace(0, 10, 100)
y = np.sin(x)

plt.plot(x, y, color='green')

plt.fill_between(x, -0.5, 0.5, color='red', alpha=0.5)

plt.show()
Output:
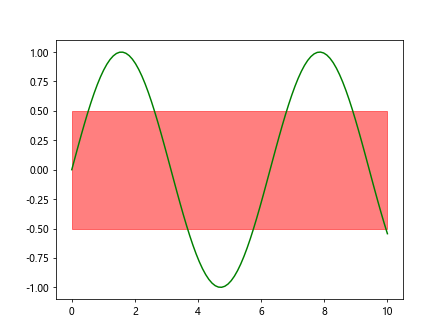
In this example, we plot the curve y = sin(x) and fill the area between the horizontal lines at y = -0.5 and y = 0.5 with a red color.
plt fill between Conclusion
In conclusion, the plt.fill_between() function in Matplotlib is a powerful tool for highlighting specific regions in a plot or showing the uncertainty in data. By customizing fill styles, adding hatching, stacking fills, adjusting transparency, and filling between vertical or horizontal lines, you can create visually appealing and informative plots. Experiment with different parameters and styles to find the best way to present your data.