Legend Outside Plot Matplotlib
When you create plots using Matplotlib, sometimes the legend can overlap with the plot itself, making it difficult to read. In such cases, you may want to move the legend outside the plot area. This article will guide you on how to achieve this using Matplotlib in Python.
Basic Legend Placement
By default, Matplotlib places the legend inside the plot area. To move the legend outside the plot, you can use the bbox_to_anchor parameter of the plt.legend() function. This parameter specifies the anchor point of the legend box in normalized coordinates (0 to 1).
Here is an example of moving the legend to the upper right corner of the plot:
import matplotlib.pyplot as plt

# Create a simple plot
plt.plot([1, 2, 3, 4], [1, 4, 9, 16], label='Data')

# Move the legend to the upper right corner
plt.legend(loc='upper right', bbox_to_anchor=(1, 1))

plt.show()
Output:
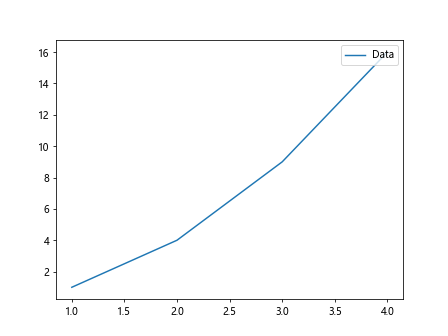
In this example, loc='upper right' specifies that the legend should be placed in the upper right corner of the plot, and bbox_to_anchor=(1, 1) moves the legend to the top-right corner of the plot area.
Placing Legend Outside Plot
To place the legend completely outside the plot area, you can adjust the bbox_to_anchor parameter further. Here is an example of placing the legend above the plot:
import matplotlib.pyplot as plt

# Create a simple plot
plt.plot([1, 2, 3, 4], [1, 4, 9, 16], label='Data')

# Move the legend above the plot
plt.legend(loc='upper center', bbox_to_anchor=(0.5, 1.1))

plt.show()
Output:
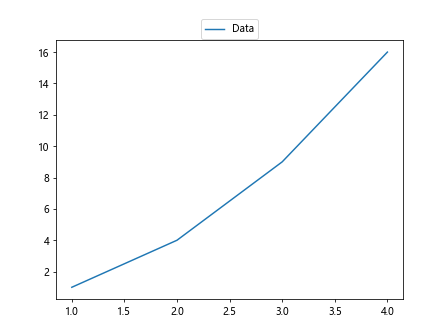
In this example, loc='upper center' specifies that the legend should be placed in the upper center of the plot, and bbox_to_anchor=(0.5, 1.1) moves the legend 10% above the top of the plot area.
Moving Legend to the Bottom
You can also move the legend to the bottom of the plot area. Here is an example of placing the legend at the bottom right corner of the plot:
import matplotlib.pyplot as plt

# Create a simple plot
plt.plot([1, 2, 3, 4], [1, 4, 9, 16], label='Data')

# Move the legend to the bottom right corner
plt.legend(loc='lower right', bbox_to_anchor=(1, 0))

plt.show()
Output:
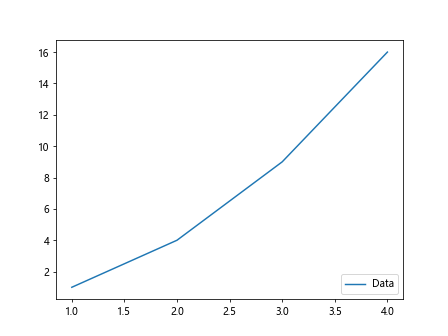
In this example, loc='lower right' specifies that the legend should be placed in the lower right corner of the plot, and bbox_to_anchor=(1, 0) moves the legend to the bottom-right corner of the plot area.
Customizing Legend Position and Size
You can further customize the position and size of the legend by adjusting the bbox_to_anchor parameter along with the borderaxespad and borderpad parameters. Here is an example of a customized legend placement:
import matplotlib.pyplot as plt

# Create a simple plot
plt.plot([1, 2, 3, 4], [1, 4, 9, 16], label='Data')

# Customizing legend position and size
plt.legend(loc='center', bbox_to_anchor=(0.5, 0.9), borderaxespad=0.5, borderpad=1)

plt.show()
Output:
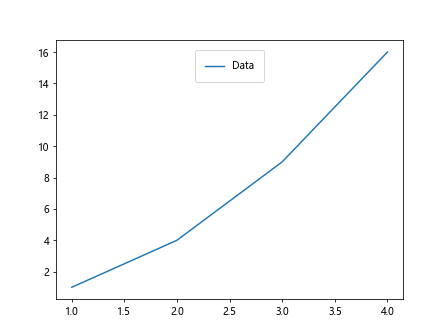
In this example, loc='center' specifies that the legend should be placed in the center of the plot, and bbox_to_anchor=(0.5, 0.9) adjusts the position of the legend box. The borderaxespad parameter adds padding between the legend and the plot area, while the borderpad parameter adds padding inside the legend box.
Multiple Legends
Sometimes you may need to add multiple legends to a plot. You can achieve this by creating separate legend objects for each set of labels. Here is an example of adding two legends to a plot:
import matplotlib.pyplot as plt

# Create a simple plot
plt.plot([1, 2, 3, 4], [1, 4, 9, 16], label='Data 1')
plt.plot([1, 2, 3, 4], [2, 5, 10, 17], label='Data 2')

# Create separate legend objects for each set of labels
legend1 = plt.legend(loc='upper right', bbox_to_anchor=(1, 1))
legend2 = plt.legend(loc='lower left', bbox_to_anchor=(0, 0))

plt.gca().add_artist(legend1)

plt.show()
Output:
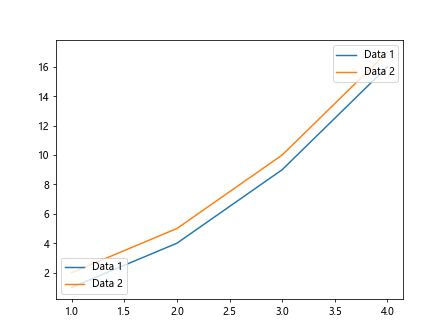
In this example, we create two separate legends for ‘Data 1’ and ‘Data 2’ using the plt.legend() function. We then add the first legend back to the plot using the plt.gca().add_artist() function.
Customizing Legend Labels
You can customize the labels of the legend using the label parameter of the plt.plot() function. Here is an example of customizing legend labels:
import matplotlib.pyplot as plt

# Create a simple plot with custom labels
plt.plot([1, 2, 3, 4], [1, 4, 9, 16], label='Label 1')
plt.plot([1, 2, 3, 4], [2, 5, 10, 17], label='Label 2')

plt.legend()

plt.show()
Output:
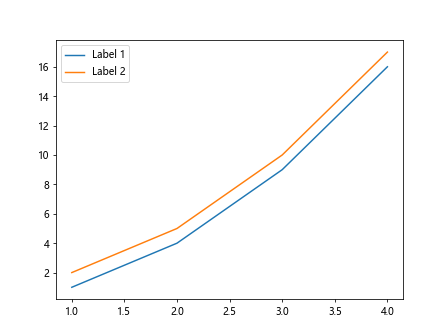
In this example, we provide custom labels ‘Label 1’ and ‘Label 2’ for the two data sets by using the label parameter of the plt.plot() function.
Adding Title to Legend
You can add a title to the legend to provide additional context to the labels. Here is an example of adding a title to the legend:
import matplotlib.pyplot as plt

# Create a simple plot
plt.plot([1, 2, 3, 4], [1, 4, 9, 16], label='Data 1')
plt.plot([1, 2, 3, 4], [2, 5, 10, 17], label='Data 2')

# Add a title to the legend
plt.legend(title='Legend Title')

plt.show()
Output:
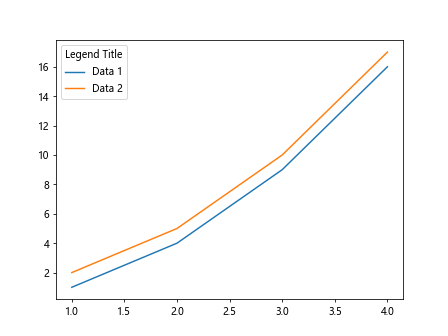
In this example, we use the title parameter of the plt.legend() function to add the title ‘Legend Title’ to the legend.
Changing Legend Title Location
You can change the location of the legend title using the title_loc parameter of the plt.legend() function. Here is an example of changing the location of the legend title:
import matplotlib.pyplot as plt

# Create a simple plot
plt.plot([1, 2, 3, 4], [1, 4, 9, 16], label='Data')

# Change the location of the legend title
plt.legend(title='Legend Title', title_loc='center')

plt.show()
In this example, we use the title_loc='center' parameter to move the legend title to the center of the legend box.
Customizing Legend Font Size and Style
You can customize the font size and style of the legend labels and title using the fontsize and title_fontsize parameters of the plt.legend() function. Here is an example of customizing the legend font size and style:
import matplotlib.pyplot as plt

# Create a simple plot
plt.plot([1, 2, 3, 4], [1, 4, 9, 16], label='Data')

# Customizing legend font size and style
plt.legend(fontsize=12, title='Legend Title', title_fontsize=14)

plt.show()
Output:
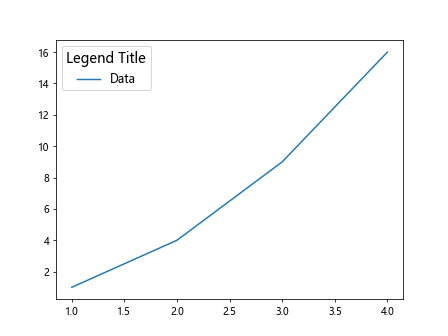
In this example, we use the fontsize=12 parameter to set the font size of the legend labels to 12, and title_fontsize=14 to set the font size of the legend title to 14.
Adjusting Spacing Between Legend Items
You can adjust the spacing between legend items using the handletextpad and handlelength parameters of the plt.legend() function. Here is an example of adjusting the spacing between legend items:
import matplotlib.pyplot as plt

# Create a simple plot
plt.plot([1, 2, 3, 4], [1, 4, 9, 16], label='Data')

# Adjusting spacing between legend items
plt.legend(handlelength=2, handletextpad=1)

plt.show()
Output:
In this example, handlelength=2 sets the length of the legend handle to 2, and handletextpad=1 adds padding between the legend handle and the label text.
Changing Legend Border Properties
You can change the border properties of the legend box using the edgecolor, facecolor, and linewidth parameters of the plt.legend() function. Here is an example of customizing the legend border properties:
import matplotlib.pyplot as plt

# Create a simple plot
plt.plot([1, 2, 3, 4], [1, 4, 9, 16], label='Data')

# Customizing legend border properties
plt.legend(edgecolor='black', facecolor='lightgrey', linewidth=1)

plt.show()
In this example, edgecolor='black' sets the color of the legend box border to black, facecolor='lightgrey' sets the color of the legend box background to light grey, and linewidth=1 sets the width of the legend box border to 1.
Adding Shadow to Legend
You can add a shadow to the legend box using the shadow parameter of the plt.legend() function. Here is an example of adding a shadow to the legend box:
import matplotlib.pyplot as plt

# Create a simple plot
plt.plot([1, 2, 3, 4], [1, 4, 9, 16], label='Data')

# Adding shadow to the legend box
plt.legend(shadow=True)

plt.show()
Output:
In this example, shadow=True adds a shadow effect to the legend box.
Changing Legend Layout
You can change the layout of the legend box using the ncol parameter of the plt.legend() function. Here is an example of changing the number of columns in the legend box:
import matplotlib.pyplot as plt

# Create a simple plot
plt.plot([1, 2, 3, 4], [1, 4, 9, 16], label='Data')

# Changing the number of columns in the legend box
plt.legend(ncol=2)

plt.show()
Output:
In this example, ncol=2 displays the legend items in two columns.
Hiding Legend
If you want to hide the legend from the plot, you can use the plt.legend().set_visible() function. Here is an example of hiding the legend:
import matplotlib.pyplot as plt

# Create a simple plot
plt.plot([1, 2, 3, 4], [1, 4, 9, 16])

# Hide the legend
plt.legend().set_visible(False)

plt.show()
In this example, plt.legend().set_visible(False) hides the legend from the plot.
Legend Outside Plot Matplotlib Conclusion
In this article, we have explored different methods to move the legend outside the plot area in Matplotlib. By adjusting the bbox_to_anchor, loc, and other parameters of the plt.legend() function, you can customize the position, size, font, border properties, and other aspects of the legend box. Experiment with these techniques to create visually appealing and informative plots in your Python projects.