Arrowprops
In Matplotlib, arrowprops are a set of properties that define the style and behavior of arrows used in various plots. Arrowprops can be used to customize the appearance of arrows in plots such as annotations, annotations with arrows, and arrows on plots.
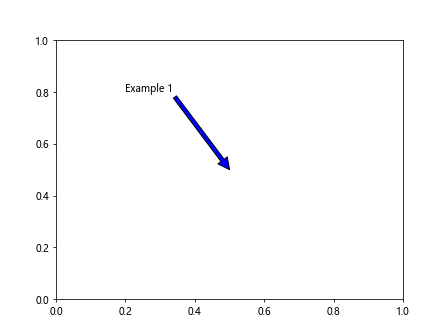
Example 1: Customize the color of the arrow
import matplotlib.pyplot as plt

fig, ax = plt.subplots()
ax.annotate('Example 1', xy=(0.5, 0.5), xytext=(0.2, 0.8),
            arrowprops=dict(facecolor='blue'))

plt.show()
Output:
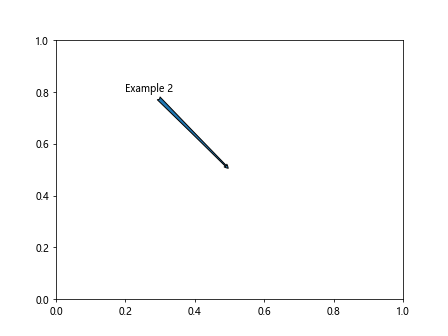
Example 2: Customize the arrow style
import matplotlib.pyplot as plt

fig, ax = plt.subplots()
ax.annotate('Example 2', xy=(0.5, 0.5), xytext=(0.2, 0.8),
            arrowprops=dict(arrowstyle='fancy'))

plt.show()
Output:
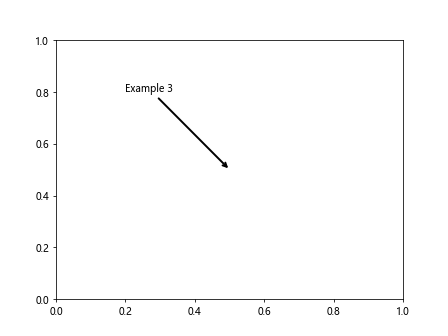
Example 3: Customize the arrow width
import matplotlib.pyplot as plt

fig, ax = plt.subplots()
ax.annotate('Example 3', xy=(0.5, 0.5), xytext=(0.2, 0.8),
            arrowprops=dict(arrowstyle='->', linewidth=2))

plt.show()
Output:
Example 4: Customize the arrow head width
import matplotlib.pyplot as plt

fig, ax = plt.subplots()
ax.annotate('Example 4', xy=(0.5, 0.5), xytext=(0.2, 0.8),
            arrowprops=dict(arrowstyle='->', headwidth=10))

plt.show()
Example 5: Customize the arrow head length
import matplotlib.pyplot as plt

fig, ax = plt.subplots()
ax.annotate('Example 5', xy=(0.5, 0.5), xytext=(0.2, 0.8),
            arrowprops=dict(arrowstyle='->', headlength=15))

plt.show()
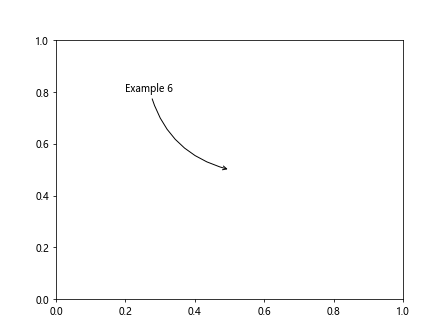
Example 6: Customize the connection style
import matplotlib.pyplot as plt

fig, ax = plt.subplots()
ax.annotate('Example 6', xy=(0.5, 0.5), xytext=(0.2, 0.8),
            arrowprops=dict(arrowstyle='->', connectionstyle='arc3, rad=0.3'))

plt.show()
Output:
Example 7: Customize the arrow tail width
import matplotlib.pyplot as plt

fig, ax = plt.subplots()
ax.annotate('Example 7', xy=(0.5, 0.5), xytext=(0.2, 0.8),
            arrowprops=dict(arrowstyle='->', tailwidth=3))

plt.show()
Example 8: Customize the arrow tail length
import matplotlib.pyplot as plt

fig, ax = plt.subplots()
ax.annotate('Example 8', xy=(0.5, 0.5), xytext=(0.2, 0.8),
            arrowprops=dict(arrowstyle='->', tailwidth=3, tailheight=10))

plt.show()
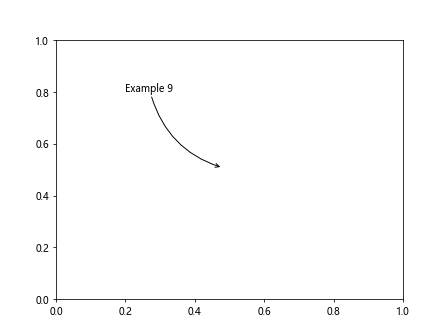
Example 9: Customize the arrow start and end points
import matplotlib.pyplot as plt

fig, ax = plt.subplots()
ax.annotate('Example 9', xy=(0.5, 0.5), xytext=(0.2, 0.8),
            arrowprops=dict(arrowstyle='->', connectionstyle='arc3, rad=0.3',
                            shrinkA=0, shrinkB=10))

plt.show()
Output:
Example 10: Customize the arrow rotation
import matplotlib.pyplot as plt

fig, ax = plt.subplots()
ax.annotate('Example 10', xy=(0.5, 0.5), xytext=(0.2, 0.8),
            arrowprops=dict(arrowstyle='->', connectionstyle='arc3, rad=0.3',
                            rotation=45))

plt.show()
Arrowprops Conclusion
Arrowprops in Matplotlib provide a flexible way to customize the appearance of arrows in plots. By using various properties such as color, style, width, and length, you can create arrows that suit your design requirements. Experiment with different arrowprops settings to create visually appealing and informative plots.