Figure Set Title in Matplotlib
In Matplotlib, we can set the title of a figure to provide a brief description or explanation of the plot. The title is usually displayed at the top of the plot. In this article, we will explore how to set the title of a figure in Matplotlib using various examples.
Basic Example
Let’s start with a basic example of setting the title of a figure in Matplotlib:
import matplotlib.pyplot as plt

plt.plot([1, 2, 3, 4], [1, 4, 9, 16])
plt.title('Example Plot')
plt.show()
Output:
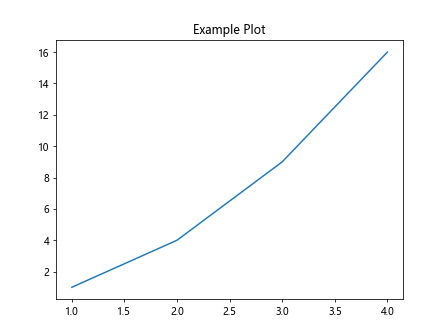
In this example, we use the plt.title() function to set the title of the plot to ‘Example Plot’.
Set Font Properties
We can also customize the font properties of the title such as the font size, font weight, and font style. Here’s an example:
import matplotlib.pyplot as plt

plt.plot([1, 2, 3, 4], [1, 4, 9, 16])
plt.title('Customized Title', fontsize=20, fontweight='bold', fontstyle='italic')
plt.show()
Output:
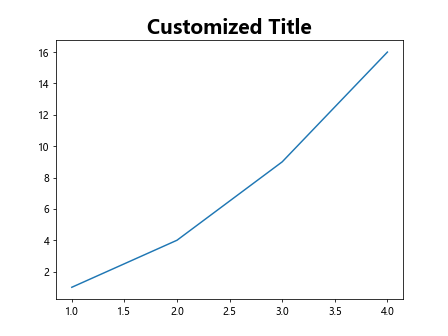
In this example, we set the font size to 20, font weight to bold, and font style to italic.
Set Title Position
We can adjust the position of the title within the plot area using the loc parameter. Here’s an example:
import matplotlib.pyplot as plt

plt.plot([1, 2, 3, 4], [1, 4, 9, 16])
plt.title('Title Position Example', loc='right')
plt.show()
Output:
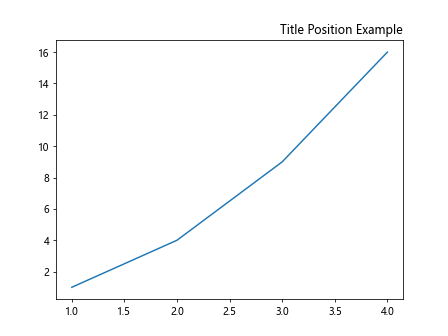
In this example, we set the title position to the right of the plot area.
Set Background Color
We can also set the background color of the title using the bbox parameter. Here’s an example:
import matplotlib.pyplot as plt

plt.plot([1, 2, 3, 4], [1, 4, 9, 16])
plt.title('Title with Background Color', bbox={'facecolor': 'red', 'alpha': 0.5})
plt.show()
Output:
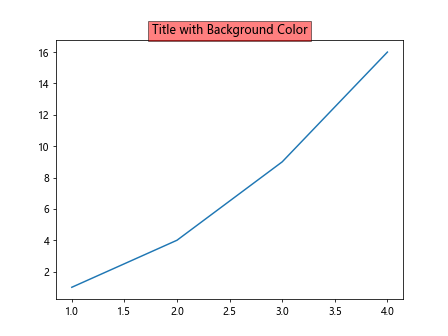
In this example, we set the background color of the title to red with an alpha value of 0.5.
Multiline Title
We can create a multiline title by using the newline character \n. Here’s an example:
import matplotlib.pyplot as plt

plt.plot([1, 2, 3, 4], [1, 4, 9, 16])
plt.title('Multiline\nTitle\nExample')
plt.show()
Output:
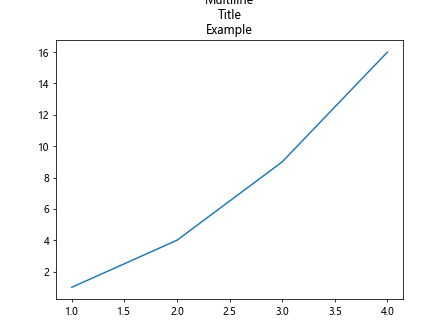
In this example, we create a multiline title with each line separated by the newline character.
Math Text in Title
Matplotlib supports using LaTeX math text in the title. Here’s an example:
import matplotlib.pyplot as plt

plt.plot([1, 2, 3, 4], [1, 4, 9, 16])
plt.title(r'$\sqrt{x}$ Function')
plt.show()
Output:
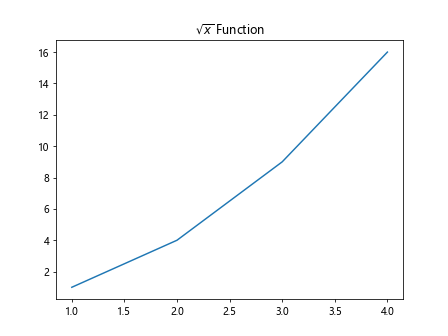
In this example, we use LaTeX math text to display the square root function in the title.
Set Title Padding
We can adjust the padding around the title using the pad parameter. Here’s an example:
import matplotlib.pyplot as plt

plt.plot([1, 2, 3, 4], [1, 4, 9, 16])
plt.title('Title Padding Example', pad=20)
plt.show()
Output:
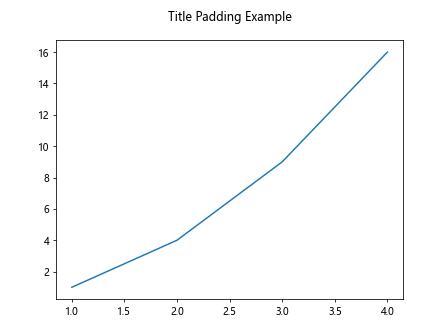
In this example, we set the padding around the title to 20 points.
Set Title Color
We can set the color of the title text using the color parameter. Here’s an example:
import matplotlib.pyplot as plt

plt.plot([1, 2, 3, 4], [1, 4, 9, 16])
plt.title('Title Color Example', color='blue')
plt.show()
Output:
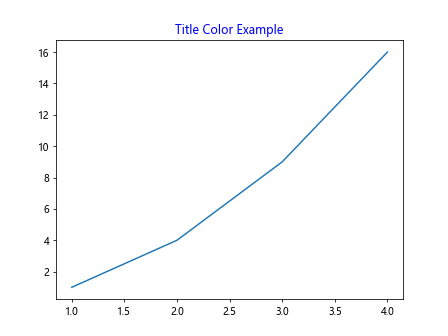
In this example, we set the title text color to blue.
Rotate Title
We can rotate the title text by specifying the rotation angle in degrees. Here’s an example:
import matplotlib.pyplot as plt

plt.plot([1, 2, 3, 4], [1, 4, 9, 16])
plt.title('Rotated Title Example', rotation=45)
plt.show()
Output:
In this example, we rotate the title text by 45 degrees.
Set Horizontal Alignment
We can adjust the horizontal alignment of the title text using the ha parameter. Here’s an example:
import matplotlib.pyplot as plt

plt.plot([1, 2, 3, 4], [1, 4, 9, 16])
plt.title('Title Alignment Example', ha='right')
plt.show()
Output:
In this example, we align the title text to the right.
Set Vertical Alignment
We can adjust the vertical alignment of the title text using the va parameter. Here’s an example:
import matplotlib.pyplot as plt

plt.plot([1, 2, 3, 4], [1, 4, 9, 16])
plt.title('Title Vertical Alignment Example', va='top')
plt.show()
Output:
In this example, we align the title text to the top of the plot area.
Set Title Font Family
We can set the font family of the title text using the fontfamily parameter. Here’s an example:
import matplotlib.pyplot as plt

plt.plot([1, 2, 3, 4], [1, 4, 9, 16])
plt.title('Title Font Family Example', fontfamily='serif')
plt.show()
Output:
In this example, we set the font family of the title text to serif.
Set Title Font Name
We can set the font name of the title text using the fontname parameter. Here’s an example:
import matplotlib.pyplot as plt

plt.plot([1, 2, 3, 4], [1, 4, 9, 16])
plt.title('Title Font Name Example', fontname='Arial')
plt.show()
Output:
In this example, we set the font name of the title text to Arial.
Set Title Border
We can add a border around the title text using the borderpad and borderaxespad parameters. Here’s an example:
import matplotlib.pyplot as plt

plt.plot([1, 2, 3, 4], [1, 4, 9, 16])
plt.title('Title Border Example', borderpad=2, borderaxespad=2)
plt.show()
In this example, we add a border around the title text with padding of 2 points.
Set Title Visibility
We can hide or show the title text using the visible parameter. Here’s an example:
import matplotlib.pyplot as plt

plt.plot([1, 2, 3, 4], [1, 4, 9, 16])
plt.title('Title Visibility Example', visible=False)
plt.show()
Output:
In this example, we hide the title text by setting the visibility to False.
Set Title Background Transparency
We can adjust the transparency of the title background using the alpha parameter. Here’s an example:
import matplotlib.pyplot as plt

plt.plot([1, 2, 3, 4], [1, 4, 9, 16])
plt.title('Title Transparency Example', bbox={'facecolor': 'yellow', 'alpha': 0.7})
plt.show()
Output:
In this example, we set the transparency of the title background to 0.7.
Set Title Rotation Mode
We can set the rotation mode of the title text using the rotation_mode parameter. Here’s an example:
import matplotlib.pyplot as plt

plt.plot([1, 2, 3, 4], [1, 4, 9, 16])
plt.title('Title Rotation Mode Example', rotation=30, rotation_mode='anchor')
plt.show()
Output:
In this example, we set the rotation mode of the title text to anchor at 30 degrees.
Set Title Size
We can adjust the font size of the title text using the size parameter. Here’s an example:
import matplotlib.pyplot as plt

plt.plot([1, 2, 3, 4], [1, 4, 9, 16])
plt.title('Title Size Example', size=18)
plt.show()
Output:
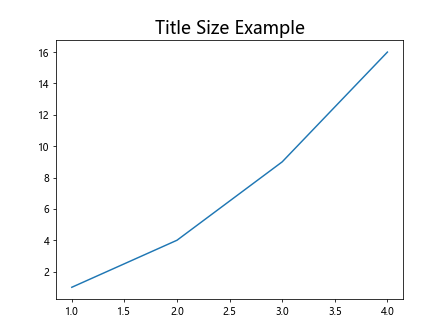
In this example, we set the font size of the title text to 18 points.
Set Title Weight
We can adjust the font weight of the title text using the weight parameter. Here’s an example:
import matplotlib.pyplot as plt

plt.plot([1, 2, 3, 4], [1, 4, 9, 16])
plt.title('Title Weight Example', weight='bold')
plt.show()
Output:
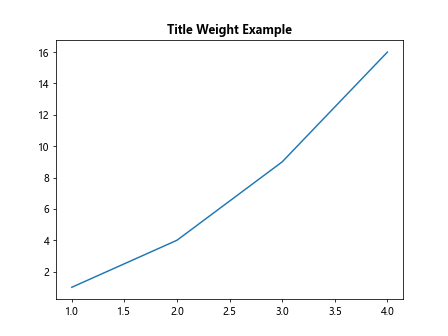
In this example, we set the font weight of the title text to bold.
Adjust Title Layout
We can adjust the layout of the title text using the loc parameter and additional spacing parameters. Here’s an example:
import matplotlib.pyplot as plt

plt.plot([1, 2, 3, 4], [1, 4, 9, 16])
plt.title('Title Layout Example', loc='right', pad=10, ha='center', va='top')
plt.show()
Output:
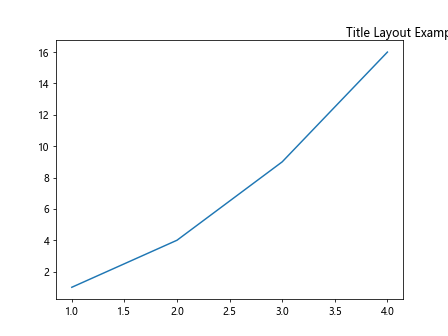
In this example, we set the title layout to be positioned at the right with additional padding, centered horizontally, and aligned to the top.
Figure Set Title in Matplotlib Conclusion
In this article, we have explored various ways to set the title of a figure in Matplotlib. We have learned how to customize the title text, adjust its position and appearance, as well as utilize advanced features like LaTeX math text and font properties. By using the examples provided, you can create visually appealing and informative titles for your Matplotlib plots. Experiment with these techniques to find the style that best suits your data visualization needs. Happy plotting!
Remember, titles are an important component of any plot as they provide context and information about the data being presented. By carefully designing and customizing the title of your figures, you can enhance the overall readability and impact of your visualizations.