Fig.title in Matplotlib
In this article, we will explore the title function in Matplotlib’s Figure class. This function allows us to set the title of a figure, which is a crucial component of data visualization to provide context and information about the plot.
Basic Usage
Let’s start by using a simple example to add a title to a figure:
import matplotlib.pyplot as plt

fig, ax = plt.subplots()
ax.plot([1, 2, 3, 4], [1, 4, 9, 16])

fig.suptitle("Simple Plot Title")
plt.show()
Output:
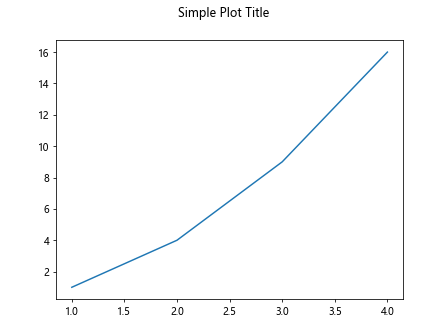
In the code above, we create a basic line plot and set the title using the suptitle function. The plot will now display the title “Simple Plot Title” above the plot.
Customizing Title Properties
We can also customize the properties of the title, such as the font size, color, weight, and alignment:
import matplotlib.pyplot as plt

fig, ax = plt.subplots()
ax.plot([1, 2, 3, 4], [1, 4, 9, 16])

title = fig.suptitle("Customized Title Properties", fontsize=16, color='blue', fontweight='bold', va='bottom')
title.set_position([0.5, 1.05])

plt.show()
Output:
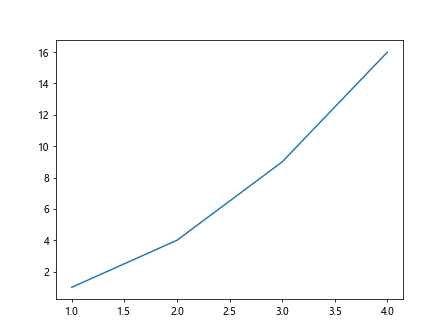
In this example, we set the font size to 16, the color to blue, the font weight to bold, and align the title to the bottom of the figure.
Multiple Subplots with Titles
We can add titles to multiple subplots in a single figure by using the fig.suptitle function for the main title and ax.set_title for individual subplot titles:
import matplotlib.pyplot as plt

fig, axs = plt.subplots(2, 2)

for i, ax in enumerate(axs.flat):
    ax.plot([1, 2, 3, 4], [1, 2, 3, 4])
    ax.set_title(f"Subplot {i+1}")

fig.suptitle("Multiple Subplots with Titles")
plt.show()
Output:
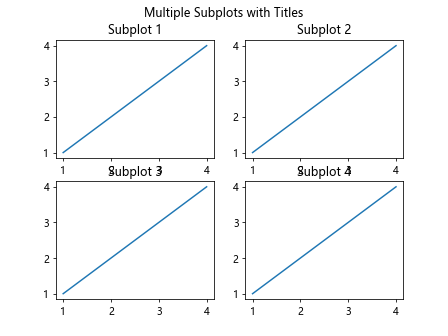
In this code snippet, we create a 2×2 grid of subplots, each with its title and a main title for the entire figure.
Using Latex in Titles
Matplotlib also supports the use of LaTeX for formatting titles. This allows for more advanced mathematical notation and symbols to be included in the title:
import matplotlib.pyplot as plt

fig, ax = plt.subplots()
ax.plot([1, 2, 3, 4], [1, 8, 27, 64])

fig.suptitle(r"$y = x^3$", fontsize=16)
plt.show()
Output:
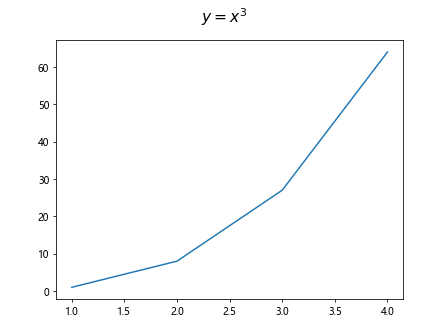
By enclosing the title string in r"", we can include LaTeX formatting in the title. In this example, the title will display the function y = x^3.
Title Alignment
The set_position function can be used to adjust the position of the title within the figure. We can specify the coordinates as a list [x, y] where (0,0) is the bottom left corner and (1,1) is the top right corner of the figure:
import matplotlib.pyplot as plt

fig, ax = plt.subplots()
ax.plot([1, 2, 3, 4], [1, 4, 9, 16])

title = fig.suptitle("Title Alignment Example")
title.set_position([0.5, 0.95])

plt.show()
Output:
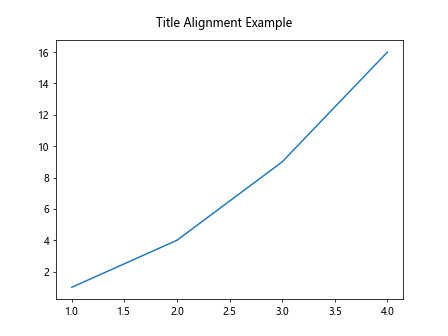
In this example, we set the title’s position to be at the top center of the figure.
Title Rotation
We can rotate the title using the set_rotation function:
import matplotlib.pyplot as plt

fig, ax = plt.subplots()
ax.plot([1, 2, 3, 4], [1, 8, 27, 64])

title = fig.suptitle("Rotated Title Example")
title.set_rotation(45)

plt.show()
Output:
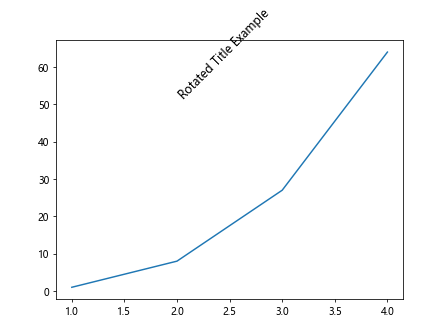
The title in this plot will be rotated 45 degrees clockwise.
Title Padding
We can adjust the padding around the title using the set_y and set_x functions:
import matplotlib.pyplot as plt

fig, ax = plt.subplots()
ax.plot([1, 2, 3, 4], [1, 4, 9, 16])

title = fig.suptitle("Title Padding Example")
title.set_y(0.95)
title.set_x(0.5)

plt.show()
Output:
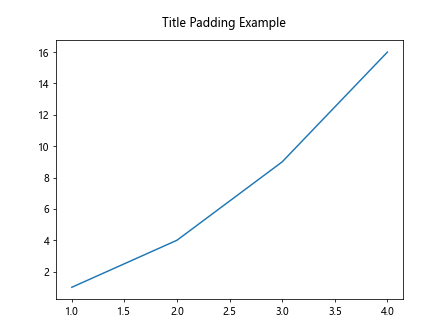
In this code, we set the y-position of the title to 0.95, creating padding between the title and the top of the figure.
Title Font Properties
We can change the font properties of the title, such as the family, style, and size, using the set_font function:
import matplotlib.pyplot as plt

fig, ax = plt.subplots()
ax.plot([1, 2, 3, 4], [1, 4, 9, 16])

title = fig.suptitle("Custom Font Properties")
title.set_fontsize(16)
title.set_fontstyle('italic')
title.set_fontfamily('serif')

plt.show()
Output:
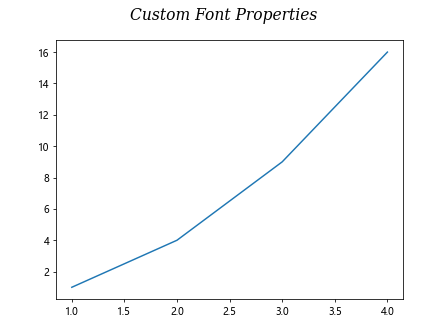
In this example, we change the font size to 16, style to italic, and family to serif.
Removing the Title
If we no longer want to display the title in a plot, we can set it to an empty string:
import matplotlib.pyplot as plt

fig, ax = plt.subplots()
ax.plot([1, 2, 3, 4], [1, 4, 9, 16])

title = fig.suptitle("Title to be Removed")
title.set_text("")

plt.show()
Output:
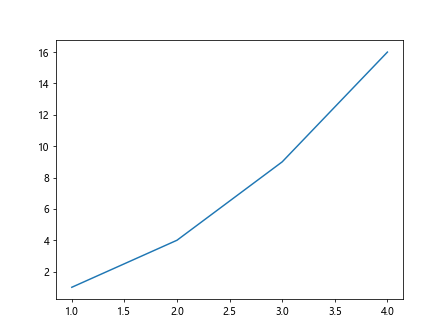
The title in this plot will be removed.
Fig.title Conclusion
In this article, we have explored the title function in Matplotlib’s Figure class. We have learned how to add titles to figures, customize title properties, create titles for multiple subplots, use LaTeX in titles, align and rotate titles, adjust padding, change font properties, and remove titles. Titles play a vital role in data visualization by providing context and information about the plot, and understanding how to use them effectively can enhance the visual appeal and communicative power of our plots. Matplotlib offers a range of options for customizing titles, allowing us to tailor them to our specific needs and preferences. Experimenting with different title styles and properties can help us create more engaging and informative visualizations.