Fig Title in Matplotlib
Fig title in Matplotlib serves as a way to provide context and information about the content of the figure. It helps to highlight the main purpose of the visual representation. In this article, we will explore different ways to add a figure title in Matplotlib plots. We will cover various scenarios and provide code examples for each case.
1. Basic Figure Title
The simplest way to add a figure title in Matplotlib is to use the title() method on the Figure object. This method takes a string as an argument and sets it as the title of the figure. Here is an example:
import matplotlib.pyplot as plt

plt.plot([1, 2, 3, 4])
plt.title("Basic Figure Title on how2matplotlib.com")
plt.show()
Output:
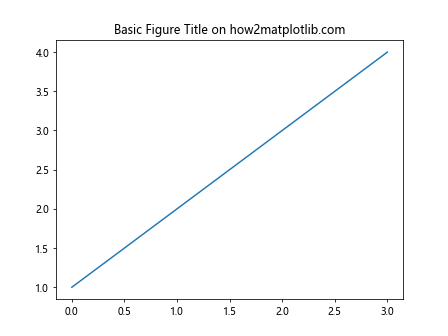
In the above code snippet, we are creating a simple plot and setting the title of the figure using the title() method.
2. Figure Title with Font Properties
You can customize the font properties of the figure title by passing additional arguments to the title() method. These arguments allow you to control the font size, font weight, font color, and other properties of the title. Here is an example:
import matplotlib.pyplot as plt

plt.plot([1, 2, 3, 4])
plt.title("Figure Title with Font Properties on how2matplotlib.com", fontsize=16, fontweight='bold', color='blue')
plt.show()
Output:
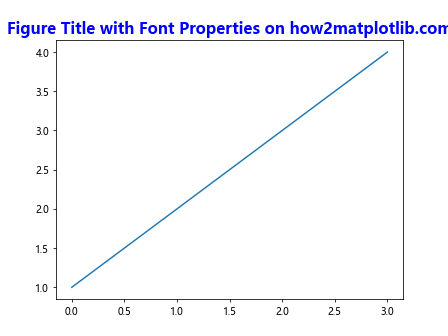
In this example, we have set the font size to 16, font weight to bold, and font color to blue for the figure title.
3. Multiline Figure Title
If you want to create a multiline figure title in Matplotlib, you can use the newline character \n to break the title into multiple lines. Here is an example:
import matplotlib.pyplot as plt

plt.plot([1, 2, 3, 4])
plt.title("Multiline\nFigure Title\non how2matplotlib.com")
plt.show()
Output:
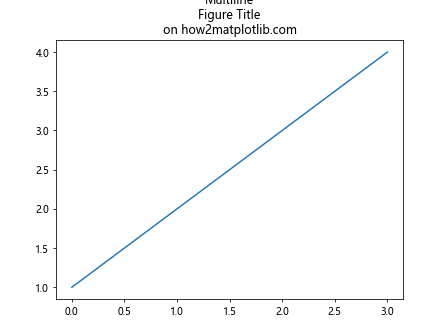
The \n character separates the title into three lines, creating a multiline figure title.
4. Figure Title Position
You can also adjust the position of the figure title within the plot by using the loc parameter. By default, the title is centered at the top of the figure. You can specify different positions such as left, right, center, and aligned to the top, bottom, left, or right of the plot. Here is an example:
import matplotlib.pyplot as plt

plt.plot([1, 2, 3, 4])
plt.title("Figure Title with Custom Position on how2matplotlib.com", loc='right', fontsize=14)
plt.show()
Output:
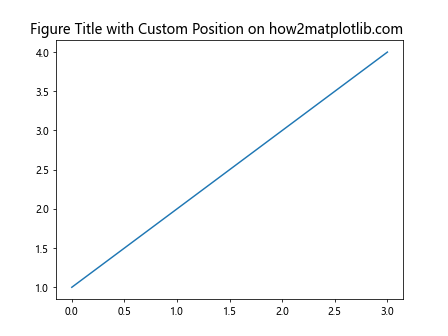
In this example, we set the title location to the right of the plot by passing loc='right' as an argument to the title() method.
5. Figure Title with Background Color
If you want to highlight the figure title by adding a background color, you can use the bbox parameter in the title() method. This parameter allows you to set the background color, transparency, and other properties of the title box. Here is an example:
import matplotlib.pyplot as plt

plt.plot([1, 2, 3, 4])
plt.title("Figure Title with Background Color on how2matplotlib.com", bbox={'facecolor': 'yellow', 'alpha': 0.5})
plt.show()
Output:
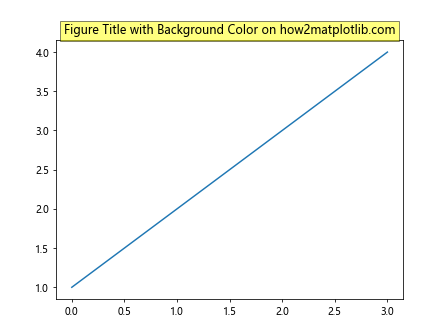
In this example, we have set the background color of the title box to yellow with a transparency of 0.5.
6. Figure Title with Padding
You can add padding around the figure title to make it more visually appealing. The pad parameter in the title() method allows you to specify the amount of padding in points. Here is an example:
import matplotlib.pyplot as plt

plt.plot([1, 2, 3, 4])
plt.title("Figure Title with Padding on how2matplotlib.com", pad=20)
plt.show()
Output:
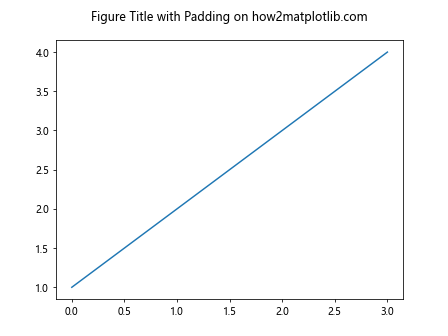
In this example, we have added 20 points of padding around the figure title.
7. Figure Title with Math Text
If you want to include mathematical expressions in the figure title, you can use LaTeX syntax within dollar signs $. Matplotlib supports rendering math text using LaTeX, allowing you to write complex mathematical formulas in the title. Here is an example:
import matplotlib.pyplot as plt

plt.plot([1, 2, 3, 4])
plt.title("Figure Title with Math Text $E=mc^2$ on how2matplotlib.com")
plt.show()
Output:
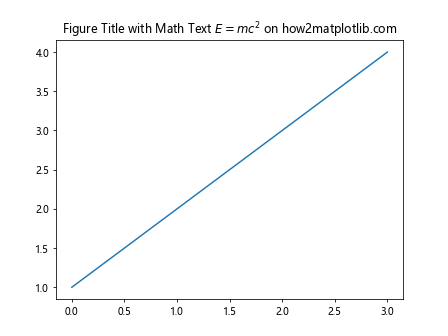
In this example, we have added the famous equation E=mc^2 as math text in the figure title.
8. Figure Title with Variable Substitution
You can dynamically insert variables or values in the figure title using formatted strings. This allows you to provide context-specific information in the title based on the data or parameters used in the plot. Here is an example:
import matplotlib.pyplot as plt

title_text = "Variable Substitution Example: a={:.2f}, b={}, c={}"
a = 3.14159
b = "how2matplotlib.com"
c = [1, 2, 3]

plt.plot([1, 2, 3, 4])
plt.title(title_text.format(a, b, c))
plt.show()
Output:
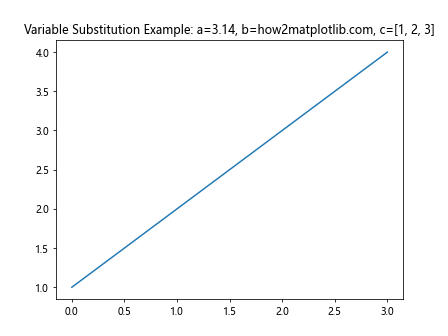
In this example, we have used formatted strings with variables a, b, and c to dynamically generate the figure title.
9. Figure Title with Timestamp
If you want to include the date and time when the plot was generated in the figure title, you can use the datetime module in Python. This allows you to provide additional context about the timing of the data visualization. Here is an example:
import matplotlib.pyplot as plt
from datetime import datetime

current_time = datetime.now().strftime("%Y-%m-%d %H:%M:%S")

plt.plot([1, 2, 3, 4])
plt.title("Figure Title with Timestamp on how2matplotlib.com\nGenerated at: {}".format(current_time))
plt.show()
Output:
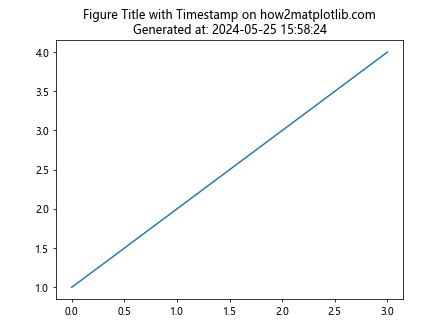
In this example, we have included the current date and time in the figure title using the datetime module.
10. Multiple Subplots with Individual Titles
If you are creating multiple subplots in a single figure, you can add individual titles to each subplot using the set_title() method on the Axes object. This allows you to provide specific titles for each subplot within the same figure. Here is an example:
import matplotlib.pyplot as plt

fig, axs = plt.subplots(2, 2)

for i, ax in enumerate(axs.flat):
    ax.plot([1, 2, 3, 4])
    ax.set_title("Subplot {}".format(i+1))

plt.tight_layout()
plt.show()
Output:
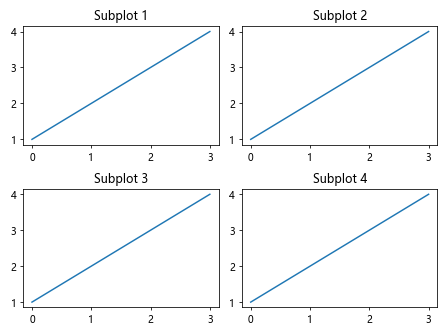
In this example, we are creating four subplots and setting individual titles for each subplot.
11. Figure Title with Image
If you want to include an image as part of the figure title, you can use the image() method from matplotlib.offsetbox. This allows you to insert images or logos in the figure title for branding or additional visual elements. Here is an example:
import matplotlib.pyplot as plt
from matplotlib.offsetbox import OffsetImage

fig, ax = plt.subplots()

arr_img = plt.imread('image.png')
imagebox = OffsetImage(arr_img, zoom=0.05)
ab = AnnotationBbox(imagebox, (0.5, 0.5), frameon=False)
ax.add_artist(ab)

plt.plot([1, 2, 3, 4])
plt.title("Figure Title with Image on how2matplotlib.com")
plt.show()
In this example, we have inserted an image in the figure title using the OffsetImage class.
12. Dynamic Figure Title Update
If you want to update the figure title dynamically based on user interactions or real-time data updates, you can use the set_title() method within a loop or event handler. This allows you to refresh the figure title with new information without creating a new plot every time. Here is an example:
import matplotlib.pyplot as plt
import time

fig, ax = plt.subplots()
line, = ax.plot([1, 2, 3, 4])
title_text = "Dynamic Figure Title on how2matplotlib.com"

for i in range(10):
    line.set_ydata([x*i for x in line.get_xdata()])
    ax.set_title(title_text + " (Iteration {})".format(i+1))
    plt.pause(0.5)

plt.show()
Output:
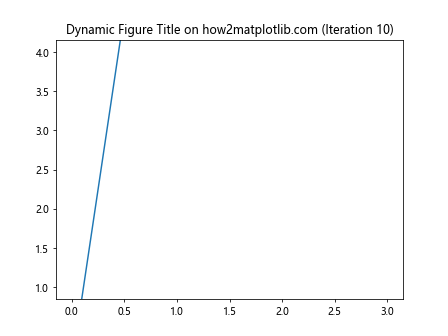
In this example, we are updating the figure title dynamically within a loop to reflect changes in the plot based on the iteration number.
13. Figure Title with HTML Text
If you want to include HTML-formatted text in the figure title, you can use the text() method from matplotlib.offsetbox to render HTML content. This allows you to add rich text and styling to the figure title for enhanced visual presentation. Here is an example:
import matplotlib.pyplot as plt
from matplotlib.offsetbox import AnchoredText
fig, ax = plt.subplots()
html_text = "HTML Formatted Figure Title
\nStyled Text
"
at = AnchoredText(html_text, loc='center', prop=dict(size=12))
ax.add_artist(at)
plt.plot([1, 2, 3, 4])
plt.show()
Output:
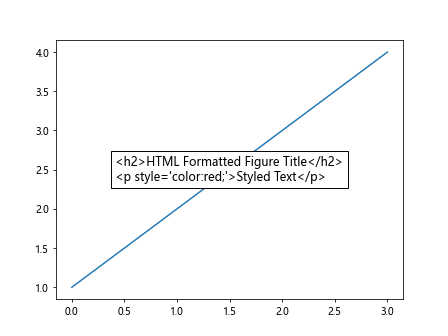
In this example, we have used the AnchoredText class to include HTML-formatted text in the figure title.
14. Figure Title with Annotations
If you want to add annotations or callouts to the figure title, you can use the annotate() method on the Axes object. This allows you to provide additional information or context for the plot within the figure title area. Here is an example:
import matplotlib.pyplot as plt

fig, ax = plt.subplots()
ax.plot([1, 2, 3, 4])
ax.set_title("Figure Title with Annotation on how2matplotlib.com")

ax.annotate('Additional Info', xy=(0.5, 1), xytext=(0.5, 1.2),
            arrowprops=dict(facecolor='black', shrink=0.05))
plt.show()
Output:
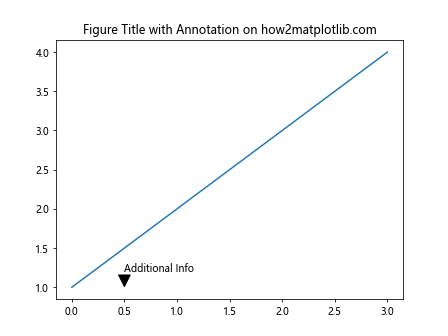
In this example, we have added an annotation with additional information to the figure title using the annotate() method.
15. Updating Figure Title Based on User Input
If you want to update the figure title based on user input or interaction, you can use input functions within a loop to capture user input and dynamically update the figure title. This allows you to customize the title based on user preferences. Here is an example:
import matplotlib.pyplot as plt

fig, ax = plt.subplots()
ax.plot([1, 2, 3, 4])
initial_title = "Figure Title on how2matplotlib.com: "
user_input = ""

while user_input != 'exit':
    user_input = input("Enter a new title (or 'exit' to quit): ")
    if user_input != 'exit':
        ax.set_title(initial_title + user_input)
        plt.pause(0.1)

plt.show()
In this example, we are continuously updating the figure title based on user input until the user decides to exit the loop.
16. Figure Title with Dynamic Data Information
If you want to include dynamic data information in the figure title, you can retrieve and display data values or statistics within the title. This allows you to provide real-time insights or details about the plotted data. Here is an example:
import matplotlib.pyplot as plt
import numpy as np

data = np.random.rand(10)
fig, ax = plt.subplots()
ax.plot(data)
ax.set_title("Dynamic Data Information: Mean = {:.2f}, Max = {}, Min = {}".format(np.mean(data), np.max(data), np.min(data)))
plt.show()
Output:
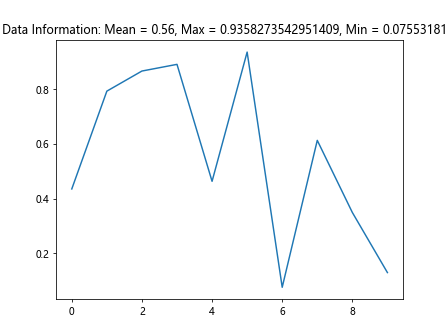
In this example, we have calculated and displayed the mean, maximum, and minimum values of the randomly generated data within the figure title.
17. Figure Title with Unicode Characters
If you want to include Unicode characters in the figure title, you can directly use Unicode strings in the title text. This allows you to add special characters, symbols, or emojis to the figure title for expressive purposes. Here is an example:
import matplotlib.pyplot as plt

plt.plot([1, 2, 3, 4])
plt.title("Figure Title with Unicode Characters 😊📊🌟 on how2matplotlib.com")
plt.show()
In this example, we have included Unicode emojis and symbols in the figure title for visual appeal.
18. Customizing Figure Title Font Style
If you want to customize the font style of the figure title, you can use the fontdict parameter in the title() method to specify font properties such as family, style, variant, and weight. This allows you to create unique title designs with different font styles. Here is an example:
import matplotlib.pyplot as plt

font_style = {'family': 'serif', 'style': 'italic', 'weight': 'bold', 'size': 16}
plt.plot([1, 2, 3, 4])
plt.title("Customized Font Style Figure Title on how2matplotlib.com", fontdict=font_style)
plt.show()
Output:
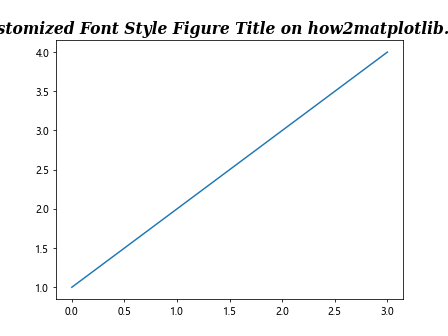
In this example, we have customized the font style of the figure title with a serif italic bold font family and size 16.
19. Figure Title with Line Break
If you want to include a line break in the figure title without using the newline character \n, you can use the set_text() method on the Text object returned by the title() method. This allows you to insert line breaks programmatically. Here is an example:
import matplotlib.pyplot as plt

title_text = "Figure Title with Line Break on how2matplotlib.com"
fig = plt.figure()
title = fig.suptitle(title_text)
title.set_text(title_text.replace("on", "on\n"))
plt.show()
Output:

In this example, we are adding a line break in the figure title by updating the text content of the title object.
20. Figure Title with Relative Position
If you want to position the figure title relative to a specific data coordinate within the plot, you can use the set_position() method on the Text object returned by the title() method. This allows you to anchor the title to a data point or location on the plot. Here is an example:
import matplotlib.pyplot as plt

fig, ax = plt.subplots()
ax.plot([1, 2, 3, 4])
title = ax.set_title("Figure Title with Relative Position on how2matplotlib.com")
title.set_position((0.5, 0.5))
plt.show()
Output:
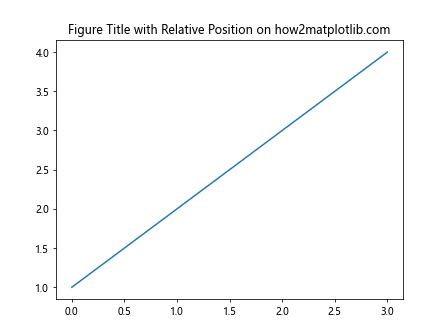
In this example, we have positioned the figure title at coordinates (0.5, 0.5) relative to the data coordinates of the plot.
These examples demonstrate the versatility of adding figure titles in Matplotlib plots and the different customization options available for enhancing the visual presentation of the plots. You can combine these techniques to create informative and visually appealing figures with relevant titles. Experiment with the provided code examples and explore more possibilities for figure title customization in Matplotlib.