Setting Title in Matplotlib Figures
Matplotlib is a powerful library for creating visualizations in Python. One important aspect of creating plots with Matplotlib is setting the title of the figure. In this article, we will explore different ways to set the title in Matplotlib figures with detailed examples.
Basic Title Setting
The simplest way to set a title in Matplotlib is by using the plt.title() function. Let’s see an example:
import matplotlib.pyplot as plt

plt.plot([1, 2, 3, 4], [1, 4, 9, 16])
plt.title('Example Plot Title - how2matplotlib.com')
plt.show()
Output:
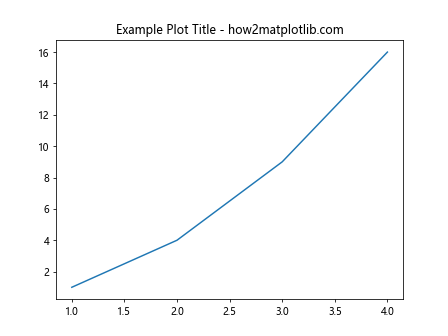
In this example, we created a simple plot and set the title using plt.title(). When you run this code, you will see the plot with the specified title.
Setting Title with Font Properties
You can also customize the font properties of the title such as font size, font weight, and font style. Here is an example:
import matplotlib.pyplot as plt

plt.plot([1, 2, 3, 4], [1, 4, 9, 16])
plt.title('Customized Title', fontsize=16, fontweight='bold', fontstyle='italic')
plt.show()
Output:
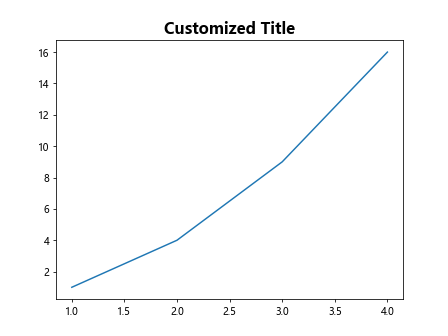
In this example, we set the font size, font weight to bold, and font style to italic for the title. You can experiment with different font properties to suit your plot.
Centering the Title
By default, the title in Matplotlib is centered. However, you can explicitly set the alignment of the title using the loc parameter. Here is an example:
import matplotlib.pyplot as plt

plt.plot([1, 2, 3, 4], [1, 4, 9, 16])
plt.title('Centered Title', loc='center')
plt.show()
Output:
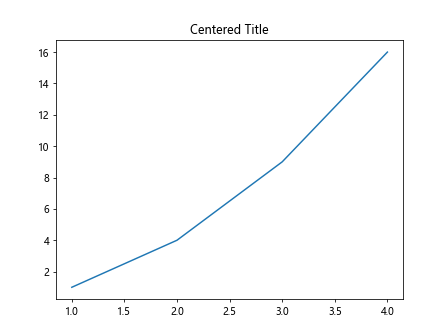
In this example, we set the title to be centered in the plot area. You can also specify loc='left' or loc='right' to align the title to the left or right of the plot, respectively.
Multiple Lines in Title
If you want to have a title with multiple lines, you can use the newline character \n to break the title into different lines. Here is an example:
import matplotlib.pyplot as plt

plt.plot([1, 2, 3, 4], [1, 4, 9, 16])
plt.title('Multi\nline\nTitle - how2matplotlib.com')
plt.show()
Output:
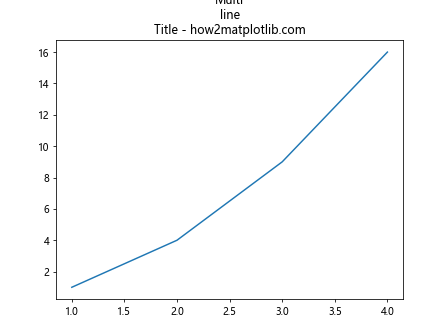
In this example, we created a title with three lines by using the newline character \n to separate the lines.
Setting Title in Subplots
When working with subplots in Matplotlib, you can set individual titles for each subplot. Here is an example of setting titles in subplots:
import matplotlib.pyplot as plt

fig, axs = plt.subplots(2, 2)

axs[0, 0].plot([1, 2, 3, 4], [1, 4, 9, 16])
axs[0, 0].set_title('Subplot 1 Title - how2matplotlib.com')

axs[0, 1].plot([1, 2, 3, 4], [1, 4, 9, 16])
axs[0, 1].set_title('Subplot 2 Title - how2matplotlib.com')

axs[1, 0].plot([1, 2, 3, 4], [1, 4, 9, 16])
axs[1, 0].set_title('Subplot 3 Title - how2matplotlib.com')

axs[1, 1].plot([1, 2, 3, 4], [1, 4, 9, 16])
axs[1, 1].set_title('Subplot 4 Title - how2matplotlib.com')

plt.show()
Output:
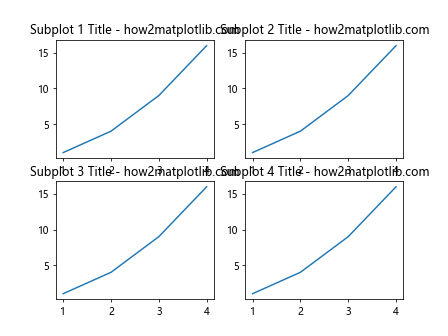
In this example, we created a 2×2 grid of subplots and set individual titles for each subplot using the set_title() function.
Title with Separator Line
You can also add a separator line below the title in Matplotlib figures for better visual separation. Here is an example:
import matplotlib.pyplot as plt

plt.plot([1, 2, 3, 4], [1, 4, 9, 16])
plt.title('Title with Separator Line - how2matplotlib.com', pad=20, linewidth=2, linestyle='--')
plt.show()
In this example, we added a separator line below the title with a padding of 20 points, a linewidth of 2, and a dashed line style.
Title Positioning
You can adjust the position of the title in Matplotlib figures using the y parameter. Here is an example:
import matplotlib.pyplot as plt

plt.plot([1, 2, 3, 4], [1, 4, 9, 16])
plt.title('Adjusted Title Position', y=1.05)
plt.show()
Output:
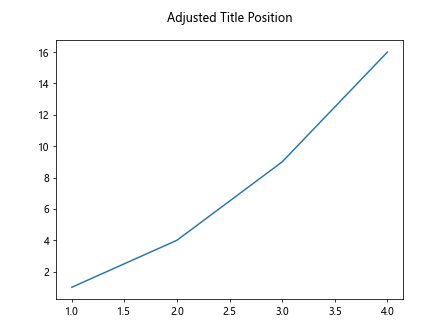
In this example, we adjusted the position of the title to be 1.05 times the height of the plot area from the top.
Title Rotation
You can rotate the title of Matplotlib figures using the rotation parameter. Here is an example:
import matplotlib.pyplot as plt

plt.plot([1, 2, 3, 4], [1, 4, 9, 16])
plt.title('Rotated Title', rotation=45)
plt.show()
Output:
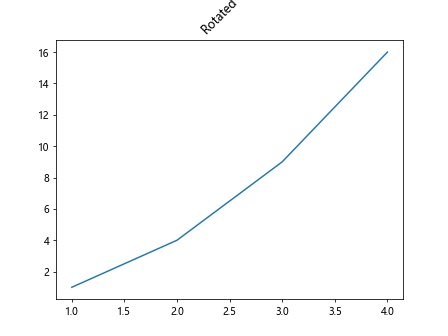
In this example, we rotated the title by 45 degrees. You can specify different rotation angles to suit your plot.
Title Color
You can change the color of the title in Matplotlib figures using the color parameter. Here is an example:
import matplotlib.pyplot as plt

plt.plot([1, 2, 3, 4], [1, 4, 9, 16])
plt.title('Colored Title', color='red')
plt.show()
Output:
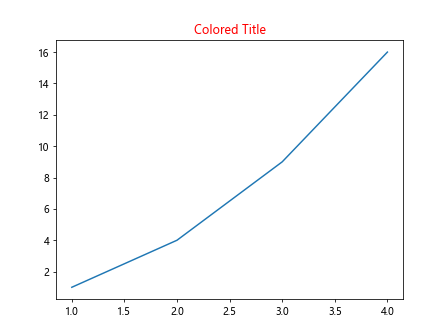
In this example, we set the color of the title to red. You can use any valid color name or hexadecimal code to specify the title color.
Conditional Title
You can set a dynamic title in Matplotlib figures based on some condition. Here is an example:
import matplotlib.pyplot as plt

x = [1, 2, 3, 4]
y = [1, 4, 9, 16]

if len(x) == len(y):
    plt.plot(x, y)
    plt.title('Conditional Title - how2matplotlib.com')
else:
    plt.title('Data Length Mismatch')
plt.show()
Output:
In this example, we check if the length of the data arrays x and y is equal. If they are equal, we plot the data with a conditional title. Otherwise, we display a different title.
Title with Timestamp
You can add a timestamp to the title of Matplotlib figures to indicate when the plot was generated. Here is an example:
import datetime
import matplotlib.pyplot as plt

now = datetime.datetime.now()
timestamp = now.strftime("%Y-%m-%d %H:%M:%S")

plt.plot([1, 2, 3, 4], [1, 4, 9, 16])
plt.title(f'Plot Generated at {timestamp} - how2matplotlib.com')
plt.show()
Output:
In this example, we added a timestamp to the title showing the date and time when the plot was generated.
Setting Title in Matplotlib Figures Conclusion
In this article, we explored various ways to set titles in Matplotlib figures with detailed examples. We covered basic title setting, customization of font properties, centering titles, handling multiple lines, setting titles in subplots, adding separator lines, adjusting title positions, rotating titles, changing title colors, conditional titles, and adding timestamps. By using these techniques, you can create visually appealing and informative plots with Matplotlib.
Remember, the title of a plot is often the first thing that viewers notice, so make sure to choose an informative and visually pleasing title for your figures.