Matplotlib Figure Size
In Matplotlib, figure size refers to the dimensions of the overall plotting area, including the axes, labels, and any other elements. Adjusting the figure size can greatly impact the appearance and readability of your plots. In this article, we will explore how to set and customize figure size in Matplotlib.
Set Figure Size
By default, Matplotlib will create plots with a figure size of 6 x 4 inches. However, you can easily customize the figure size using the figure function with the figsize parameter. The figsize parameter takes a tuple of two values specifying the width and height of the figure in inches.
import matplotlib.pyplot as plt
# Create a figure with a size of 8 x 6 inches
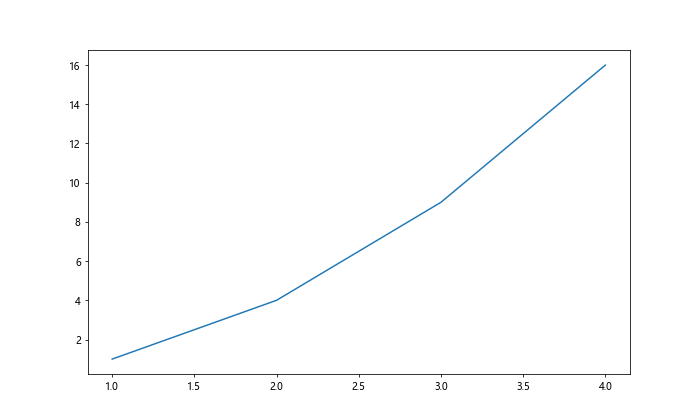
plt.figure(figsize=(8, 6))
# Plot a simple line graph
plt.plot([1, 2, 3, 4], [1, 4, 9, 16])
plt.show()
Output:
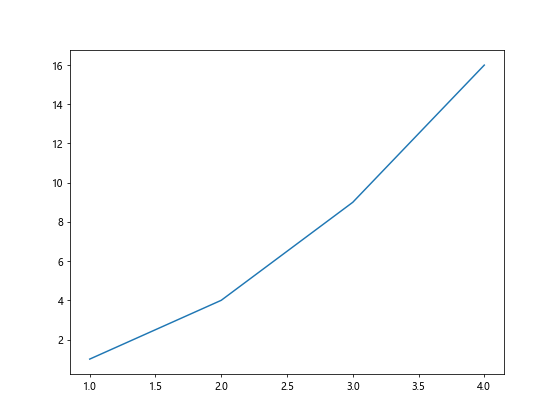
In the above example, we created a figure with a size of 8 x 6 inches using the plt.figure(figsize=(8, 6)) function. This resulted in a larger plotting area to accommodate our line graph.
Aspect Ratio
In addition to specifying the exact dimensions of the figure, you can also adjust the aspect ratio of the plot by setting the aspect parameter of the axes object. The aspect ratio is the ratio of the height to the width of the plotting area.
import matplotlib.pyplot as plt

# Create a figure with a size of 6 x 6 inches
plt.figure(figsize=(6, 6))

# Plot a circle with equal aspect ratio
plt.gca().set_aspect('equal')

circle = plt.Circle((0.5, 0.5), 0.4, color='blue')
plt.gca().add_artist(circle)

plt.xlim(0, 1)
plt.ylim(0, 1)

plt.show()
Output:
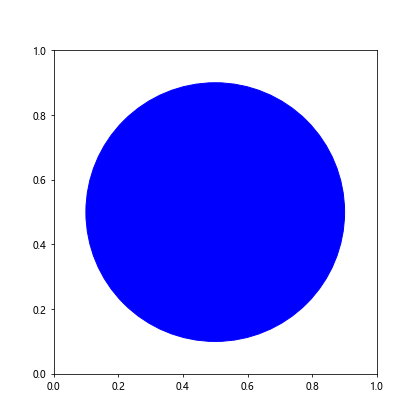
In the code above, we set the aspect ratio of the plot to be equal using plt.gca().set_aspect('equal'). This ensures that the circle we plot appears as a perfect circle and is not distorted.
Subplots
When working with multiple subplots in Matplotlib, you can control the figure size for each subplot individually. This allows you to create plots with different dimensions based on your specific requirements.
import matplotlib.pyplot as plt

# Create a figure with two subplots
fig, axs = plt.subplots(2, figsize=(8, 10))

# Plot on the first subplot
axs[0].plot([1, 2, 3, 4], [10, 5, 10, 5])

# Plot on the second subplot
axs[1].plot([1, 2, 3, 4], [1, 2, 3, 4])

plt.show()
Output:
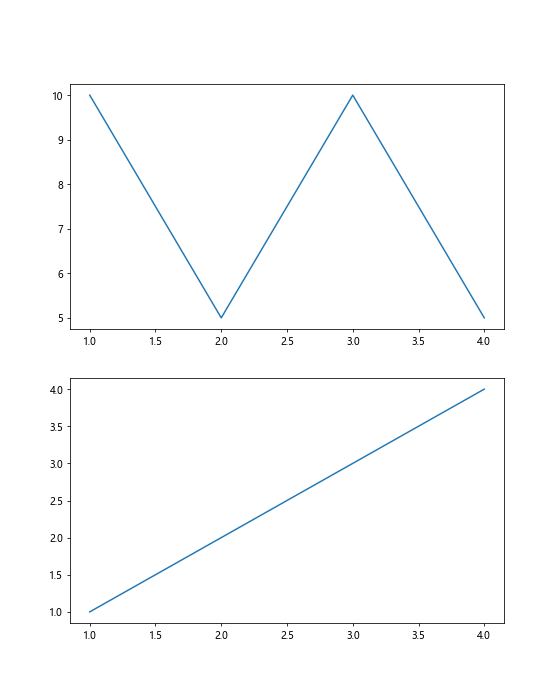
In the code snippet above, we use the plt.subplots function to create a figure with two subplots. By specifying a different figsize for each subplot, we can control the size of each plot independently.
Saving Figures with Custom Size
You can also save Matplotlib figures to external files with custom dimensions. This is useful when you need to export high-quality plots for presentations or reports.
import matplotlib.pyplot as plt

# Create a figure with a size of 10 x 8 inches
plt.figure(figsize=(10, 8))

# Plot a scatter plot
plt.scatter([1, 2, 3, 4], [10, 5, 3, 8])

# Save the figure with custom size
plt.savefig('scatter_plot.png', dpi=300)

plt.show()
Output:
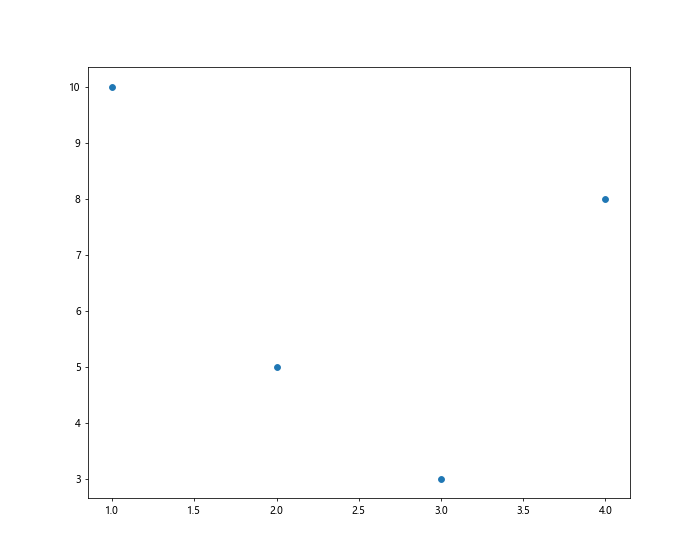
In the example above, we create a figure with a size of 10 x 8 inches and plot a scatter plot. We then save the figure as a PNG file with a resolution of 300 DPI, which ensures high-quality output.
Customizing Default Figure Size
If you find yourself frequently using the same figure size for your plots, you can customize the default figure size for all plots in your script. This allows you to avoid specifying the figure size for each plot individually.
import matplotlib.pyplot as plt

# Set the default figure size for all plots
plt.rcParams['figure.figsize'] = [10, 6]

# Plot a simple line graph
plt.plot([1, 2, 3, 4], [1, 4, 9, 16])

plt.show()
Output:
In the code snippet above, we use plt.rcParams['figure.figsize'] to set the default figure size for all plots in the script. This way, any subsequent plots will automatically use the specified dimensions.
Adjusting Figure Size in Seaborn Plots
When using Seaborn, which is built on top of Matplotlib, you can also adjust the figure size for your plots. The process is very similar to what we have seen with Matplotlib.
import seaborn as sns
import matplotlib.pyplot as plt

# Create a figure with a size of 8 x 6 inches
plt.figure(figsize=(8, 6))

# Plot a Seaborn bar plot
sns.barplot(x=[1, 2, 3, 4], y=[10, 5, 3, 8])

plt.show()
Output:
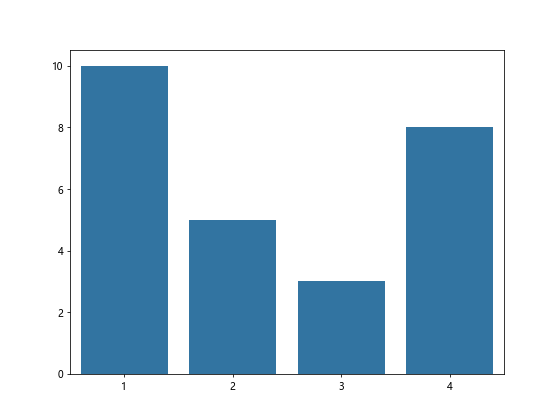
In the code above, we create a figure with a size of 8 x 6 inches using Matplotlib and then plot a Seaborn bar plot. Seaborn seamlessly integrates with Matplotlib, allowing you to adjust the figure size as needed.
Handling Figure Size in Interactive Plots
When working with interactive plots in Jupyter notebooks or other interactive environments, you may need to adjust the figure size interactively. Matplotlib provides a convenient way to do this with the pyplot.figure function.
import matplotlib.pyplot as plt

# Create an interactive figure with manual resizing
plt.figure()

# Plot a line graph
plt.plot([1, 2, 3, 4], [1, 4, 9, 16])

plt.show()
Output:
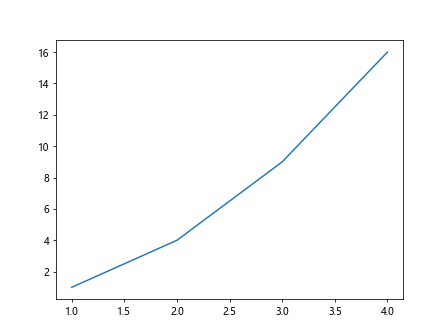
In the code above, we create an interactive figure that allows for manual resizing by the user. This can be helpful when working in interactive environments where the figure size may need to be adjusted dynamically.
Controlling Figure Size in 3D Plots
When creating 3D plots in Matplotlib, you can also adjust the figure size to ensure that the plot is visually appealing and easy to interpret.
import matplotlib.pyplot as plt
from mpl_toolkits.mplot3d import Axes3D

# Create a figure with a size of 10 x 8 inches
fig = plt.figure(figsize=(10, 8))
ax = fig.add_subplot(111, projection='3d')

# Plot a 3D scatter plot
ax.scatter([1, 2, 3, 4], [10, 5, 3, 8], [1, 2, 3, 4])

plt.show()
Output:
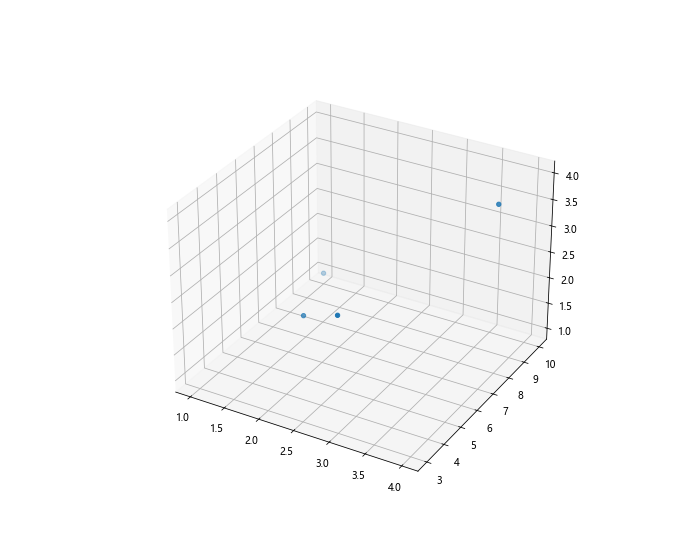
In the code snippet above, we create a 3D scatter plot with a figure size of 10 x 8 inches. This helps ensure that the 3D plot is clear and well-proportioned.
Customizing Layouts with GridSpec
GridSpec is a powerful tool in Matplotlib for customizing layouts of subplots within a figure. You can use GridSpec to create complex layouts with varying sizes of subplots.
import matplotlib.pyplot as plt
from matplotlib.gridspec import GridSpec

# Create a figure with custom layout
fig = plt.figure()

# Define the GridSpec layout
gs = GridSpec(2, 2, width_ratios=[2, 1], height_ratios=[1, 2])

# Create subplots with custom sizes
ax1 = plt.subplot(gs[0])
ax2 = plt.subplot(gs[1])
ax3 = plt.subplot(gs[2])
ax4 = plt.subplot(gs[3])

plt.show()
Output:
In the example above, we use GridSpec to create a custom layout with 2 rows and 2 columns, each with a different size ratio. This allows for more flexible and visually appealing subplot arrangements.
Matplotlib Figure Size Conclusion
In conclusion, figure size plays a crucial role in the appearance and readability of plots in Matplotlib. By adjusting the figure size, aspect ratio, and default settings, you can create visually appealing plots that effectively communicate your data. Experiment with different figure sizes and layouts to find the optimal settings for your specific requirements.