The Ultimate Guide to Figsize in Matplotlib
When creating a plot in Matplotlib, setting the figure size is an important step in ensuring that the resulting visualization looks just right. In this guide, we will explore everything you need to know about setting the figsize parameter in Matplotlib to customize the size and aspect ratio of your plots.
Basic Usage of figsize
The figsize parameter in Matplotlib is used to specify the width and height of the figure in inches. The default figsize is (6.4, 4.8), but you can easily customize it to better suit your needs.
Here is an example of how to set the figsize when creating a simple plot:
import matplotlib.pyplot as plt

x = [1, 2, 3, 4, 5]
y = [2, 3, 5, 7, 11]

plt.figure(figsize=(8, 6))
plt.plot(x, y)
plt.show()
Output:
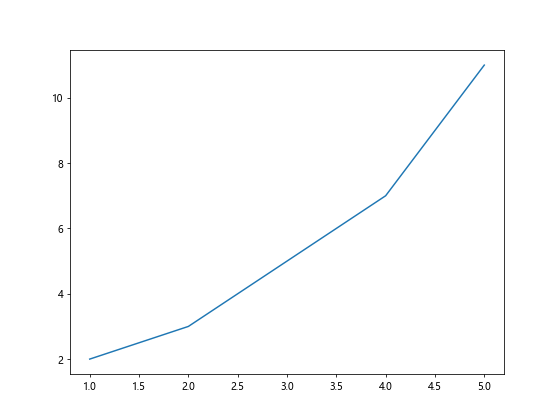
In this example, we set the width to 8 inches and the height to 6 inches for the figure. You can adjust the values to create plots of different sizes.
Changing Aspect Ratio with figsize
In addition to setting the absolute size of the figure, you can also adjust the aspect ratio by changing the width and height. This allows you to control the relative proportions of the plot.
Here is an example of how to create a plot with a specific aspect ratio using figsize:
import matplotlib.pyplot as plt

x = [1, 2, 3, 4, 5]
y = [2, 3, 5, 7, 11]

plt.figure(figsize=(6, 3))
plt.plot(x, y)
plt.show()
Output:
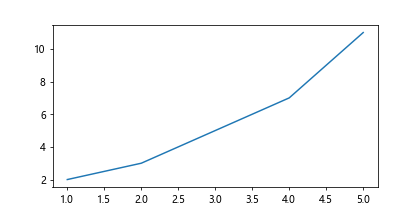
By setting the height to half of the width, we create a plot with a 2:1 aspect ratio. Experiment with different values to see how it affects the appearance of the plot.
Subplots with Custom Figsize
When creating subplots in Matplotlib, you can set the figsize individually for each subplot. This allows you to create plots with different sizes and aspect ratios in the same figure.
Here is an example of how to create subplots with custom figsize:
import matplotlib.pyplot as plt

x = [1, 2, 3, 4, 5]
y = [2, 3, 5, 7, 11]

fig, axes = plt.subplots(2, 2, figsize=(10, 8))

axes[0, 0].plot(x, y)
axes[0, 1].scatter(x, y)
axes[1, 0].bar(x, y)
axes[1, 1].pie(y)

plt.show()
Output:
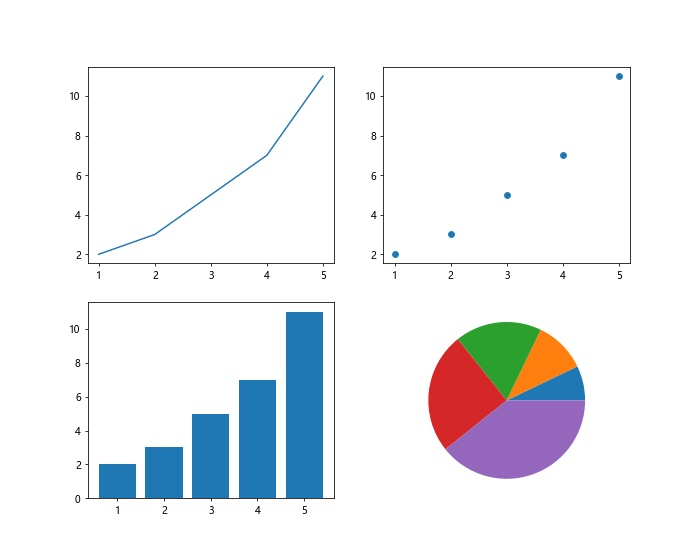
In this example, we create a 2×2 grid of subplots with a total figsize of 10×8 inches. Each subplot can have its own figsize to accommodate different types of visualizations.
Using tight_layout with Custom Figsize
When working with multiple subplots, you may encounter issues with overlapping elements. The tight_layout function in Matplotlib helps to automatically adjust the spacing between subplots to prevent overlap.
Here is an example of how to use tight_layout with custom figsize:
import matplotlib.pyplot as plt

x = [1, 2, 3, 4, 5]
y = [2, 3, 5, 7, 11]

fig, axes = plt.subplots(2, 2, figsize=(10, 8))

axes[0, 0].plot(x, y)
axes[0, 1].scatter(x, y)
axes[1, 0].bar(x, y)
axes[1, 1].pie(y)

plt.tight_layout()
plt.show()
Output:
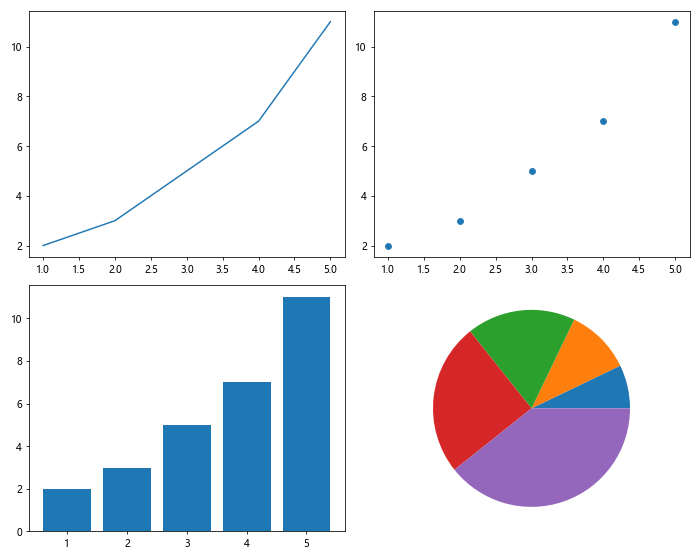
By calling tight_layout after creating the subplots, we ensure that the elements are properly spaced out within the figure.
Saving Figures with Custom Figsize
Once you have created a plot with a custom figsize, you may want to save it to a file for later use or sharing. Matplotlib allows you to save figures in various formats with the specified dimensions.
Here is an example of how to save a figure with a custom figsize to a PNG file:
import matplotlib.pyplot as plt

x = [1, 2, 3, 4, 5]
y = [2, 3, 5, 7, 11]

plt.figure(figsize=(8, 6))
plt.plot(x, y)
plt.savefig('custom_figure.png')
In this example, we create a plot with a figsize of 8×6 inches and save it as a PNG file named custom_figure.png. You can also save figures in formats such as PDF, SVG, or EPS.
Using rcParams for Default Figsize
If you frequently create plots with a specific figsize, you can set a default value for figsize in Matplotlib’s rcParams. This allows you to avoid specifying the figsize for every plot you create.
Here is an example of how to set a default figsize using rcParams:
import matplotlib as mpl
import matplotlib.pyplot as plt

x = [1, 2, 3, 4, 5]
y = [2, 3, 5, 7, 11]

mpl.rcParams['figure.figsize'] = (10, 6)

plt.plot(x, y)
plt.show()
Output:
By setting figure.figsize in rcParams, all subsequent plots will use the specified width and height unless overridden by a specific figsize parameter.
Creating Multiple Figures with Custom Figsize
In some cases, you may need to create multiple figures with different sizes within the same script. Matplotlib allows you to manage multiple figures and customize their sizes independently.
Here is an example of how to create two figures with custom figsizes:
import matplotlib.pyplot as plt

x = [1, 2, 3, 4, 5]
y = [2, 3, 5, 7, 11]

plt.figure(figsize=(8, 6))
plt.plot(x, y)
plt.show()

plt.figure(figsize=(6, 4))
plt.scatter(x, y)
plt.show()
In this example, we create two separate figures with different sizes. Each figure is displayed independently, allowing you to compare them side by side.
Adjusting Figsize for Different Plots
Different types of plots may benefit from specific figsizes to highlight certain aspects of the data. For instance, a scatter plot with many data points may require a larger figsize to avoid overcrowding.
Here is an example of how to adjust the figsize for a scatter plot:
import numpy as np
import matplotlib.pyplot as plt

x = [1, 2, 3, 4, 5]
y = [2, 3, 5, 7, 11]

x = np.random.randn(1000)
y = np.random.randn(1000)

plt.figure(figsize=(8, 6))
plt.scatter(x, y)
plt.show()
Output:
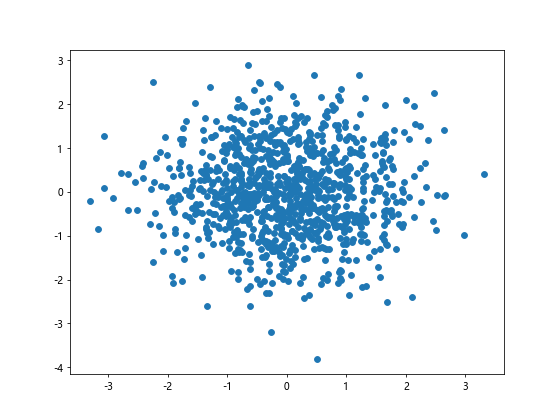
By increasing the figsize to 8×6 inches, we provide more space for the data points in the scatter plot, making it easier to visualize the distribution.
Customizing Figsize for Publication
When creating plots for publication or presentation, you may need to adhere to specific size requirements. Matplotlib allows you to customize the figsize to meet the dimensions mandated by journals or conference guidelines.
Here is an example of how to create a plot with publication-ready figsize:
import matplotlib.pyplot as plt

x = [1, 2, 3, 4, 5]
y = [2, 3, 5, 7, 11]

plt.figure(figsize=(6.4, 4.8))
plt.plot(x, y)
plt.savefig('publication_figure.png', dpi=300)
In this example, we set the figsize to the default size of (6.4, 4.8) and save the plot as a high-resolution PNG file with 300 DPI for clarity.
figsize matplotlib Conclusion
In this guide, we have covered everything you need to know about customizing the figsize in Matplotlib to create visually appealing and informative plots. By adjusting the width and height of the figure, as well as the aspect ratio, you can tailor your visualizations to better convey your data.
Experiment with different figsize values and aspect ratios to find the perfect combination that suits your plotting needs. Whether you are creating a simple line plot or a complex set of subplots, the figsize parameter in Matplotlib offers a versatile way to control the size and appearance of your plots.