Line Thickness in Matplotlib
Matplotlib is a powerful library for creating visualizations in Python. One aspect of creating plots in Matplotlib is controlling the thickness of lines. In this article, we will explore how to set the line thickness in Matplotlib plots.
Setting Line Thickness in Matplotlib Plots
In Matplotlib, you can control the thickness of lines by using the linewidth or lw parameter when plotting. The line thickness is specified in points.
Here is an example code snippet that demonstrates how to set the line thickness in a Matplotlib plot:
import matplotlib.pyplot as plt

x = [1, 2, 3, 4, 5]
y = [2, 4, 6, 8, 10]

plt.plot(x, y, linewidth=2)
plt.xlabel('X-axis')
plt.ylabel('Y-axis')
plt.title('Line Plot with Thickness')
plt.show()
Output:
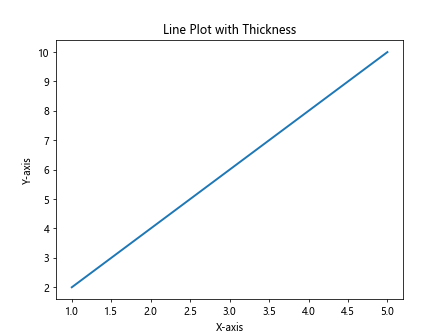
In this example, the linewidth=2 parameter sets the line thickness to 2 points. You can adjust the value to change the thickness of the line.
Customizing Line Thickness in Matplotlib
You can also set the line thickness for specific components of a plot, such as grid lines or axes. Here is an example code snippet that demonstrates how to customize the line thickness of grid lines:
import matplotlib.pyplot as plt

x = [1, 2, 3, 4, 5]
y = [2, 4, 6, 8, 10]

plt.plot(x, y)
plt.grid(linewidth=0.5)
plt.xlabel('X-axis')
plt.ylabel('Y-axis')
plt.title('Line Plot with Customized Grid Line Thickness')
plt.show()
Output:
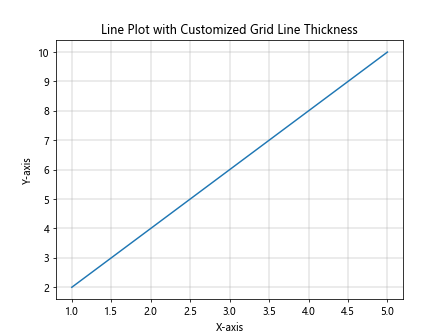
In this example, the linewidth=0.5 parameter sets the thickness of grid lines to 0.5 points. You can adjust the value to change the thickness of the grid lines.
Changing Line Thickness in Multiple Plots
If you have multiple plots in the same figure, you can set the line thickness for each plot individually. Here is an example code snippet that demonstrates how to change the line thickness for different plots:
import matplotlib.pyplot as plt

x1 = [1, 2, 3, 4, 5]
y1 = [2, 4, 6, 8, 10]

x2 = [1, 2, 3, 4, 5]
y2 = [1, 3, 5, 7, 9]

plt.plot(x1, y1, linewidth=2)
plt.plot(x2, y2, linewidth=1)
plt.xlabel('X-axis')
plt.ylabel('Y-axis')
plt.title('Multiple Line Plots with Different Thickness')
plt.show()
Output:
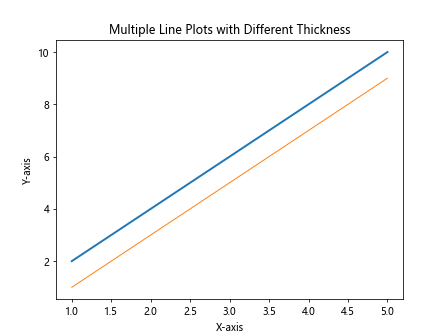
In this example, the first plot has a line thickness of 2 points, while the second plot has a line thickness of 1 point.
Setting Line Thickness for Specific Plot Elements
You can also set the line thickness for specific plot elements, such as the legend or text annotations. Here is an example code snippet that demonstrates how to customize the line thickness of a legend:
import matplotlib.pyplot as plt

x = [1, 2, 3, 4, 5]
y = [2, 4, 6, 8, 10]

plt.plot(x, y, label='Line', linewidth=2)
plt.legend(handlelength=2)
plt.xlabel('X-axis')
plt.ylabel('Y-axis')
plt.title('Line Plot with Customized Legend Line Thickness')
plt.show()
Output:
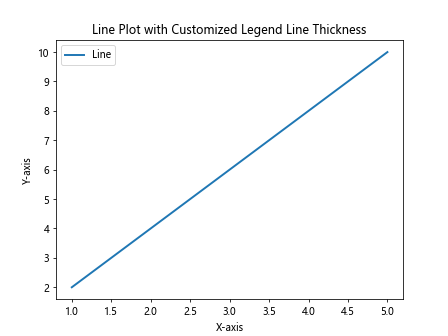
In this example, the handlelength=2 parameter sets the thickness of the legend line to 2 points.
Line Thickness in Matplotlib Summary
Controlling the line thickness in Matplotlib plots is essential for creating visually appealing visualizations. By using the linewidth or lw parameter, you can easily adjust the thickness of lines in your plots. Additionally, customizing the line thickness for specific components of a plot can help emphasize different aspects of your data.
In this article, we covered various aspects of setting line thickness in Matplotlib plots, including setting the line thickness for plot lines, grid lines, legends, and more. Experiment with the examples provided to create plots with the desired line thickness for your data visualization needs.