Adjusting Subplots with fig.subplots_adjust
When creating multiple subplots in a matplotlib figure, it is often necessary to adjust the spacing between the subplots to achieve the desired layout. The fig.subplots_adjust method allows you to control the spacing around and between the subplots in a figure. In this article, we will explore how to use fig.subplots_adjust to customize the layout of subplots in a matplotlib figure.
Basic Usage
The fig.subplots_adjust method accepts four optional parameters: left, right, bottom, and top, which control the spacing around the subplots in the figure. The values passed to these parameters are fractions of the figure width or height.
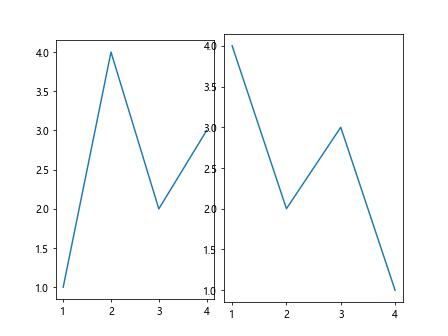
Let’s start by creating a simple figure with two subplots and adjusting the spacing using fig.subplots_adjust:
import matplotlib.pyplot as plt

fig, axs = plt.subplots(1, 2)
fig.subplots_adjust(left=0.2, right=0.8, bottom=0.3, top=0.7)

axs[0].plot([1, 2, 3, 4], [1, 4, 2, 3])
axs[1].plot([1, 2, 3, 4], [4, 2, 3, 1])

plt.show()
Output:
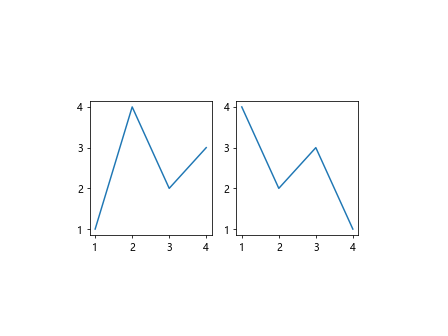
In this example, we create a figure with two subplots arranged horizontally. We use fig.subplots_adjust to set the spacing around the subplots, making sure they have enough room without overlapping.
Adjusting Spacing in Multi-row or Column Layouts
When working with multiple rows or columns of subplots, you may want to adjust the spacing between the rows or columns. The hspace and wspace parameters of fig.subplots_adjust control the spacing between subplots along the horizontal and vertical directions.
Let’s create a figure with two rows and three columns of subplots and adjust the spacing between them:
import matplotlib.pyplot as plt

fig, axs = plt.subplots(2, 3)
fig.subplots_adjust(left=0.1, right=0.9, bottom=0.1, top=0.9, hspace=0.5, wspace=0.3)

for i in range(2):
    for j in range(3):
        axs[i, j].plot([1, 2, 3, 4], [1, 4, 2, 3])

plt.show()
Output:
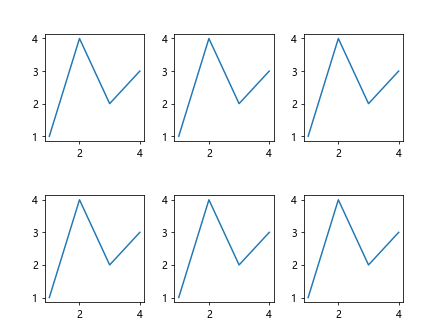
In this example, we create a 2×3 grid of subplots and use fig.subplots_adjust to space out the subplots vertically and horizontally.
Adjusting the Size of the Figure
In addition to adjusting the spacing around the subplots, you can also control the overall size of the figure using the figsize parameter of plt.subplots.
Let’s create a figure with a specified figure size and adjust the spacing around the subplots:
import matplotlib.pyplot as plt

fig, axs = plt.subplots(1, 2, figsize=(10, 5))
fig.subplots_adjust(left=0.1, right=0.9, bottom=0.1, top=0.9)

axs[0].plot([1, 2, 3, 4], [1, 4, 2, 3])
axs[1].plot([1, 2, 3, 4], [4, 2, 3, 1])

plt.show()
Output:
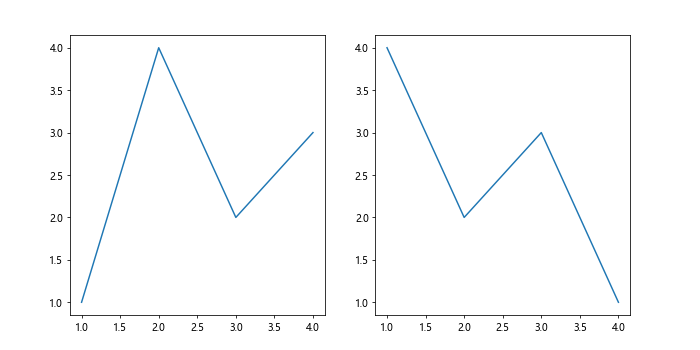
In this example, we create a figure with a width of 10 inches and a height of 5 inches. We then use fig.subplots_adjust to adjust the spacing around the subplots.
Adjusting Spacing Dynamically
Sometimes you may want to adjust the spacing between subplots dynamically based on the content within each subplot. The tight_layout function in matplotlib automatically adjusts the spacing between subplots to fit the content.
Let’s create a figure with two subplots and use tight_layout to adjust the spacing:
import matplotlib.pyplot as plt

fig, axs = plt.subplots(1, 2)

axs[0].plot([1, 2, 3, 4], [1, 4, 2, 3])
axs[1].plot([1, 2, 3, 4], [4, 2, 3, 1])

plt.tight_layout()

plt.show()
Output:
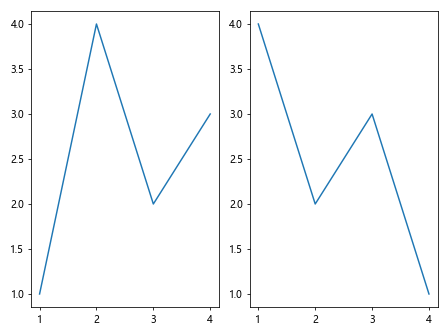
In this example, we create a figure with two subplots and use tight_layout to automatically adjust the spacing between the subplots.
Adjusting Individual Subplot Positions
In addition to adjusting the spacing around subplots, you can also adjust the position of individual subplots within the figure using the set_position method.
Let’s create a figure with two subplots and adjust the position of the second subplot:
import matplotlib.pyplot as plt

fig, axs = plt.subplots(1, 2)

axs[0].plot([1, 2, 3, 4], [1, 4, 2, 3])

axs[1].plot([1, 2, 3, 4], [4, 2, 3, 1])
axs[1].set_position([0.5, 0.1, 0.4, 0.8])

plt.show()
Output:
In this example, we create a figure with two subplots and use set_position to adjust the position of the second subplot within the figure.
Adjusting Spacing for Polar Subplots
If you are working with polar subplots, you can adjust the spacing around the subplots using the polar=True parameter in plt.subplots.
Let’s create a figure with two polar subplots and adjust the spacing around them:
import matplotlib.pyplot as plt

fig, axs = plt.subplots(1, 2, subplot_kw={'polar': True})
fig.subplots_adjust(left=0.1, right=0.9, bottom=0.1, top=0.9)

axs[0].plot([0, 1, 2, 3], [1, 2, 3, 4])
axs[1].plot([0, 1, 2, 3], [4, 3, 2, 1])

plt.show()
Output:
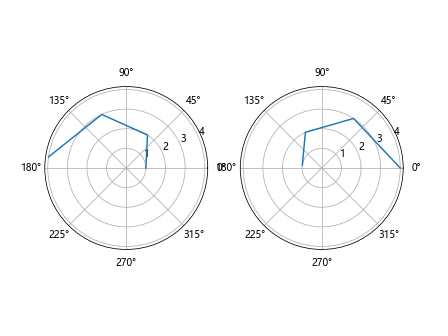
In this example, we create a figure with two polar subplots and adjust the spacing around them using fig.subplots_adjust.
Adjusting Spacing for Image Subplots
If you are working with image subplots, you can adjust the spacing around the subplots using the aspect='auto' parameter in imshow.
Let’s create a figure with two image subplots and adjust the spacing around them:
import matplotlib.pyplot as plt
import numpy as np

image1 = np.random.random((10, 10))
image2 = np.random.random((10, 10))

fig, axs = plt.subplots(1, 2)

axs[0].imshow(image1, aspect='auto')
axs[1].imshow(image2, aspect='auto')

plt.tight_layout()

plt.show()
Output:
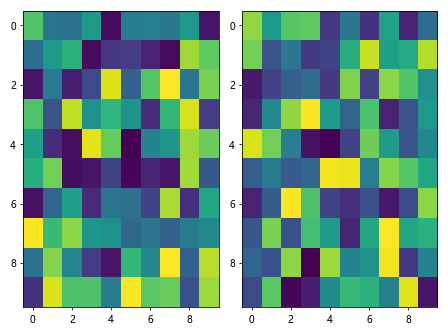
In this example, we create a figure with two image subplots and adjust the spacing around them using tight_layout.
Creating Subplots with Custom Grid Specs
If you need more control over the layout of subplots, you can create subplots with custom grid specifications using GridSpec.
Let’s create a figure with subplots arranged in a custom grid layout using GridSpec:
import matplotlib.pyplot as plt
from matplotlib.gridspec import GridSpec

fig = plt.figure()
gs = GridSpec(2, 2, figure=fig)

ax1 = fig.add_subplot(gs[0, 0])
ax2 = fig.add_subplot(gs[0, 1])
ax3 = fig.add_subplot(gs[1, :])

ax1.plot([1, 2, 3, 4], [1, 4, 2, 3])
ax2.plot([1, 2, 3, 4], [4, 2, 3, 1])
ax3.plot([1, 2, 3, 4], [2, 3, 1, 4])

plt.show()
Output:
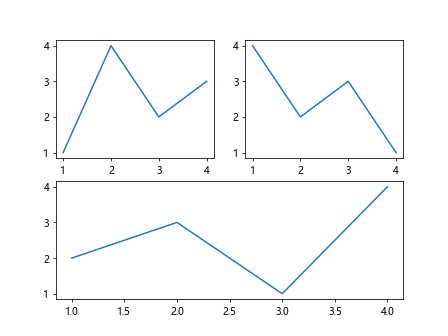
In this example, we create a figure with subplots arranged in a 2×2 grid using GridSpec and add_subplot.
Adjusting Spacing in Nested Grid Layouts
If you have nested grid layouts in your subplots, you canadjust the spacing between the nested grids using subplots_adjust.
Let’s create a figure with nested grid layouts and adjust the spacing between them using subplots_adjust:
import matplotlib.pyplot as plt
from matplotlib.gridspec import GridSpec

fig = plt.figure()
gs_outer = GridSpec(2, 2, figure=fig)
gs_inner1 = gs_outer[0, 1].subgridspec(2, 1)
gs_inner2 = gs_outer[1, 0].subgridspec(1, 2)

ax1 = fig.add_subplot(gs_outer[0, 0])
ax2 = fig.add_subplot(gs_outer[0, 1])
ax3 = fig.add_subplot(gs_inner1[0])
ax4 = fig.add_subplot(gs_inner1[1])
ax5 = fig.add_subplot(gs_inner2[0])
ax6 = fig.add_subplot(gs_inner2[1])

fig.subplots_adjust(left=0.1, right=0.9, bottom=0.1, top=0.9, wspace=0.2, hspace=0.3)

plt.show()
Output:
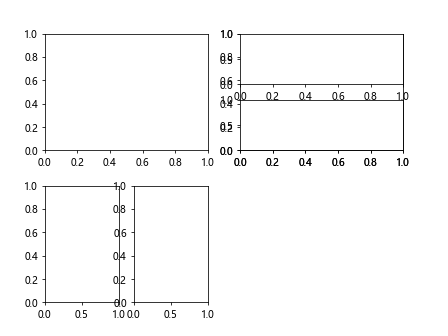
In this example, we create a figure with nested grid layouts using GridSpec and adjust the spacing between the nested grids using subplots_adjust.
Adjusting Spacing for Insets
If you have insets or additional axes within your subplots, you can adjust the spacing around them using fig.subplots_adjust.
Let’s create a figure with insets in one of the subplots and adjust the spacing around them:
import matplotlib.pyplot as plt

fig, axs = plt.subplots(1, 2)

axs[0].plot([1, 2, 3, 4], [1, 4, 2, 3])

ax_inset = axs[1].inset_axes([0.1, 0.1, 0.3, 0.3])
ax_inset.plot([1, 2, 3, 4], [4, 3, 2, 1])

fig.subplots_adjust(bottom=0.2)

plt.show()
Output:
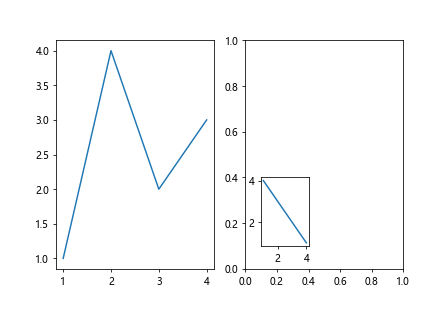
In this example, we create a figure with an inset in one of the subplots using inset_axes and adjust the spacing around the inset using fig.subplots_adjust.
Adjusting Spacing for Colorbars
If you have colorbars in your subplots, you can adjust the spacing around them using fig.subplots_adjust.
Let’s create a figure with a colorbar and adjust the spacing around it:
import matplotlib.pyplot as plt
import numpy as np

fig, axs = plt.subplots(1, 2)
im = axs[0].imshow(np.random.random((10, 10)))

cbar = fig.colorbar(im, ax=axs[1])
fig.subplots_adjust(right=0.8)

plt.show()
Output:
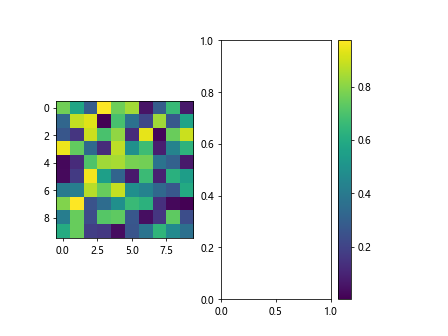
In this example, we create a figure with a colorbar and adjust the spacing around the colorbar using fig.subplots_adjust.
Adjusting Subplots with fig.subplots_adjust Conclusion
In this article, we have explored how to use fig.subplots_adjust to customize the layout of subplots in a matplotlib figure. By adjusting the spacing around and between the subplots, you can create visually appealing and organized layouts for your data visualizations. Experiment with the examples provided in this article to create unique and customized subplot arrangements in your matplotlib figures.