Understanding plt.subplots in Matplotlib
Matplotlib is a powerful visualization library in Python that is widely used for creating various types of charts and graphs. One of the key components in Matplotlib is plt.subplots, which is used to create multiple subplots in a single figure.
Basic Usage of plt.subplots
The plt.subplots function is used to create a figure and a set of subplots. It returns a figure object and an array of Axes objects, which can be used to modify the individual subplots.
import matplotlib.pyplot as plt

fig, ax = plt.subplots()
ax.plot([1, 2, 3, 4], [1, 4, 9, 16])
plt.show()
Output:
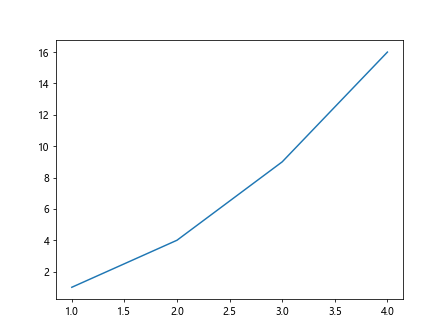
In this example, we create a simple plot with plt.subplots and display it using plt.show().
Creating Multiple Subplots
plt.subplots can also be used to create multiple subplots in a single figure by specifying the number of rows and columns.
import matplotlib.pyplot as plt

fig, axs = plt.subplots(2, 2)
axs[0, 0].plot([1, 2, 3, 4], [1, 4, 9, 16])
axs[0, 1].plot([1, 2, 3, 4], [2, 5, 10, 17])
axs[1, 0].plot([1, 2, 3, 4], [3, 6, 11, 18])
axs[1, 1].plot([1, 2, 3, 4], [4, 7, 12, 19])
plt.show()
Output:
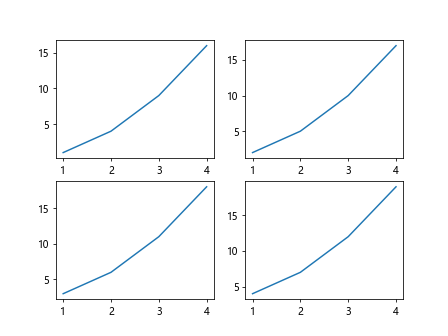
In this example, we create a 2×2 grid of subplots and plot different data on each subplot.
Customizing Subplots
You can customize each subplot individually by accessing the corresponding Axes object from the array returned by plt.subplots.
import matplotlib.pyplot as plt

fig, axs = plt.subplots(2, 2)
axs[0, 0].plot([1, 2, 3, 4], [1, 4, 9, 16], color='red', linestyle='--', marker='o')
axs[0, 1].plot([1, 2, 3, 4], [2, 5, 10, 17], color='blue', linestyle='-', marker='x')
axs[1, 0].plot([1, 2, 3, 4], [3, 6, 11, 18], color='green', linestyle='-.', marker='s')
axs[1, 1].plot([1, 2, 3, 4], [4, 7, 12, 19], color='purple', linestyle=':', marker='^')
plt.show()
Output:
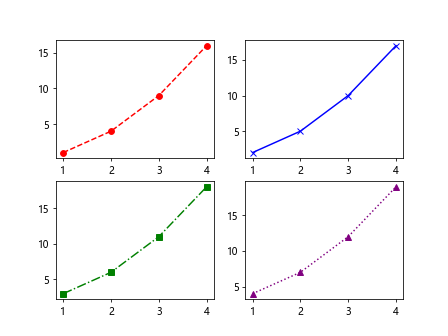
In this example, we customize the color, linestyle, and marker of each subplot.
Adding Titles and Labels
You can add titles and labels to each subplot to provide more information about the data being displayed.
import matplotlib.pyplot as plt

fig, axs = plt.subplots(2, 2)
axs[0, 0].plot([1, 2, 3, 4], [1, 4, 9, 16])
axs[0, 0].set_title('Subplot 1')
axs[0, 0].set_xlabel('X-axis')
axs[0, 0].set_ylabel('Y-axis')

axs[0, 1].plot([1, 2, 3, 4], [2, 5, 10, 17])
axs[0, 1].set_title('Subplot 2')
axs[0, 1].set_xlabel('X-axis')
axs[0, 1].set_ylabel('Y-axis')

plt.show()
Output:
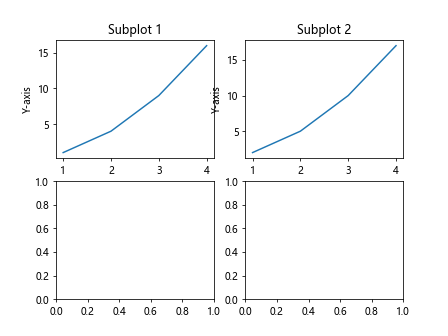
In this example, we add titles, x-axis labels, and y-axis labels to the subplots.
Adding Legends
Legends can be added to subplots to explain the different data series visually.
import matplotlib.pyplot as plt

fig, axs = plt.subplots(2, 2)
axs[0, 0].plot([1, 2, 3, 4], [1, 4, 9, 16], label='Line 1')
axs[0, 0].legend()

axs[0, 1].plot([1, 2, 3, 4], [2, 5, 10, 17], label='Line 2')
axs[0, 1].legend()

plt.show()
Output:
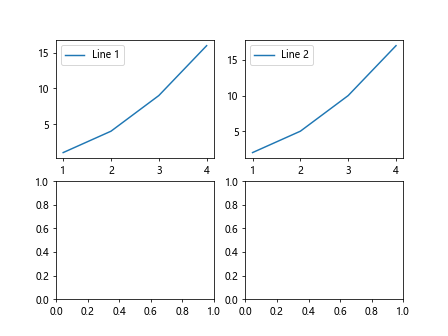
In this example, we add legends to the subplots to label the different data series.
Setting Axis Limits
You can set the limits of the x and y axes for each subplot to focus on a specific range of values.
import matplotlib.pyplot as plt

fig, axs = plt.subplots(2, 2)
axs[0, 0].plot([1, 2, 3, 4], [1, 4, 9, 16])
axs[0, 0].set_xlim(0, 5)
axs[0, 0].set_ylim(0, 20)

axs[0, 1].plot([1, 2, 3, 4], [2, 5, 10, 17])
axs[0, 1].set_xlim(0, 5)
axs[0, 1].set_ylim(0, 20)

plt.show()
Output:
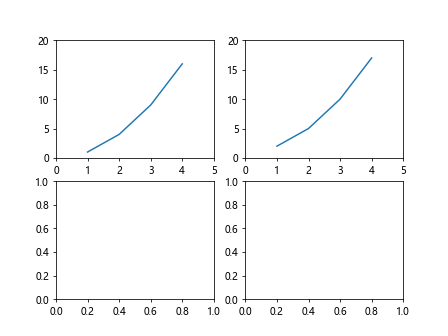
In this example, we set the limits of the x and y axes for each subplot.
Controlling Grid Lines
You can control the visibility and style of grid lines in subplots to help with data interpretation.
import matplotlib.pyplot as plt

fig, axs = plt.subplots(2, 2)
axs[0, 0].plot([1, 2, 3, 4], [1, 4, 9, 16])
axs[0, 0].grid(True, linestyle='--')

axs[0, 1].plot([1, 2, 3, 4], [2, 5, 10, 17])
axs[0, 1].grid(True, linestyle=':')

plt.show()
Output:
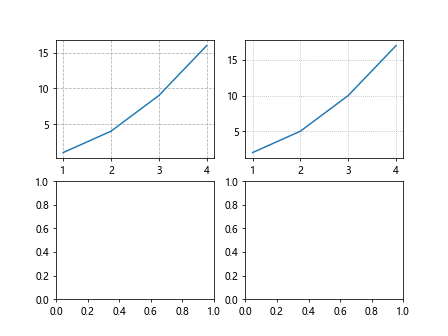
In this example, we enable grid lines with different line styles in the subplots.
Saving Figures
You can save the entire figure with all the subplots as an image file for further use.
import matplotlib.pyplot as plt

fig, axs = plt.subplots(2, 2)
axs[0, 0].plot([1, 2, 3, 4], [1, 4, 9, 16])
axs[0, 1].plot([1, 2, 3, 4], [2, 5, 10, 17])

plt.savefig('subplots.png')
plt.show()
Output:
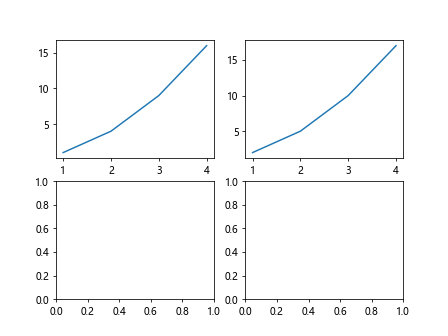
In this example, we save the figure with subplots as a PNG image file.
Combining plt.subplots with Other Matplotlib Functions
You can combine plt.subplots with other Matplotlib functions to create more complex and customized plots.
import matplotlib.pyplot as plt

fig, axs = plt.subplots(2, 2)
axs[0, 0].plot([1, 2, 3, 4], [1, 4, 9, 16], label='Line 1')
axs[0, 0].set_title('Subplot 1')
axs[0, 0].legend()

axs[0, 1].scatter([1, 2, 3, 4], [2, 5, 10, 17], label='Points', color='red')
axs[0, 1].set_title('Subplot 2')
axs[0, 1].legend()

plt.show()
Output:
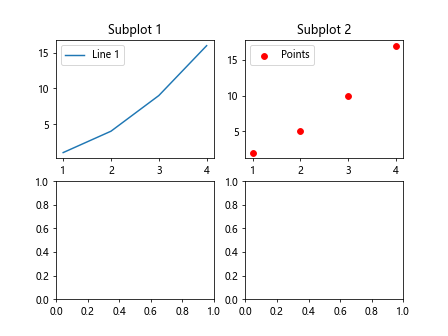
In this example, we combine plt.subplots with the plot and scatter functions to create a plot with lines and points.
plt.subplots Conclusion
In this article, we have explored the plt.subplots function in Matplotlib and how it can be used to create multiple subplots in a single figure. We have seen various examples of customizing subplots, adding titles and labels, legends,setting axis limits, controlling grid lines, saving figures, and combining plt.subplots with other Matplotlib functions. By understanding how to effectively use plt.subplots, you can create visually appealing and informative plots for your data visualization needs.
In conclusion, plt.subplots is a valuable tool in Matplotlib that allows you to create and customize multiple subplots within a single figure. Experiment with the different parameters and options available to create unique and insightful visualizations for your data.
Experiment with the examples provided in this article and explore the additional functionalities and customization options available in Matplotlib to further enhance your plots. Happy plotting!
Remember to refer to the Matplotlib documentation for more information on plt.subplots and other functions within the library. Keep practicing and experimenting with different plot configurations to become more proficient in creating meaningful visualizations with Matplotlib.