plt errorbar style
When it comes to visualizing data, error bars are a crucial component to show the uncertainty or variability in the data. In this article, we will explore different styles of error bars using Matplotlib’s errorbar function.
Basic error bars
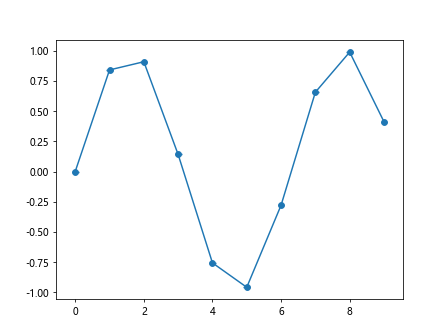
First, let’s start with the most basic use case of error bars. In this example, we will create a simple line plot with error bars of constant value.
import matplotlib.pyplot as plt
import numpy as np

x = np.arange(0, 10, 1)
y = np.sin(x)

error = 0.1

plt.errorbar(x, y, yerr=error, fmt='-o')
plt.show()
Output:
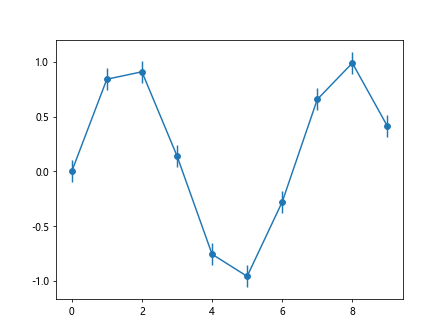
In this code snippet, we create a line plot with error bars showing a constant error value of 0.1. The fmt='-o' argument specifies that we want to plot lines and circles at data points.
Varying error bars
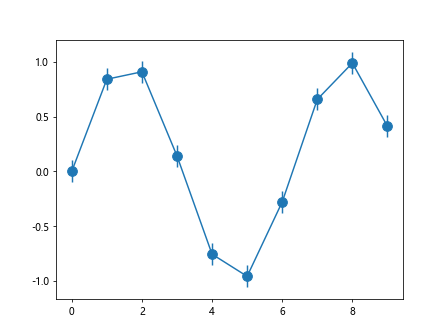
Next, let’s look at a case where the error bars have varying values for each data point. We can achieve this by specifying an array for the yerr parameter.
import matplotlib.pyplot as plt
import numpy as np

x = np.arange(0, 10, 1)
y = np.sin(x)
error = np.abs(np.random.normal(0, 0.2, y.shape))

plt.errorbar(x, y, yerr=error, fmt='-o')
plt.show()
Output:
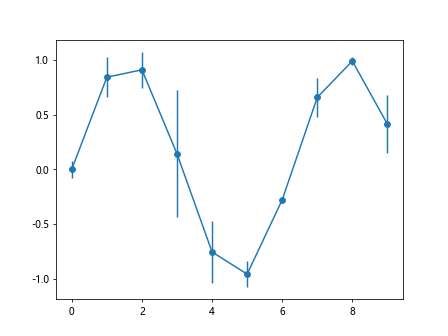
In this example, we generate random error values using the np.random.normal function and apply it to the error bars. This creates a plot with varying error bars for each data point.
Customizing error bar styles
Matplotlib allows us to customize the style of the error bars by specifying various parameters. Let’s look at some examples of customizing error bar styles.
Changing error bar color
We can change the color of the error bars by setting the ecolor parameter.
import matplotlib.pyplot as plt
import numpy as np

x = np.arange(0, 10, 1)
y = np.sin(x)
error = 0.1

plt.errorbar(x, y, yerr=error, fmt='-o', ecolor='red')
plt.show()
Output:
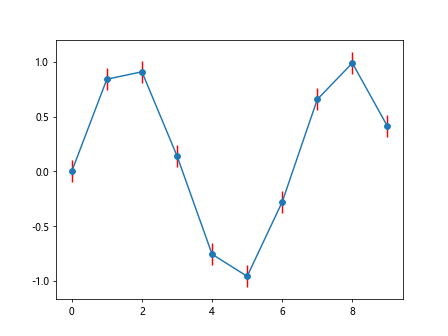
In this code snippet, we set the color of the error bars to red by specifying ecolor='red'.
Changing error bar line style
We can change the line style of the error bars using the ls parameter.
import matplotlib.pyplot as plt
import numpy as np

x = np.arange(0, 10, 1)
y = np.sin(x)
error = 0.1

plt.errorbar(x, y, yerr=error, fmt='-o', ls='--')
plt.show()
In this example, we set the error bar line style to dashed by specifying ls='--'.
Changing error bar cap style
We can change the cap style of the error bars using the capsize parameter.
import matplotlib.pyplot as plt
import numpy as np

x = np.arange(0, 10, 1)
y = np.sin(x)
error = 0.1

plt.errorbar(x, y, yerr=error, fmt='-o', capsize=5)
plt.show()
Output:
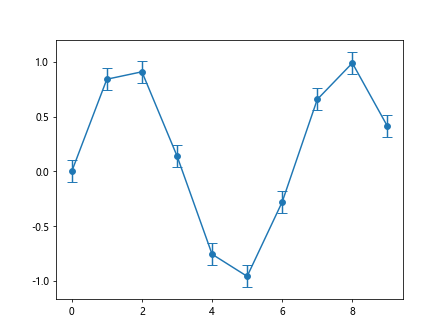
In this code snippet, we set the cap size of the error bars to 5 by specifying capsize=5.
Adding horizontal error bars
So far, we have only looked at vertical error bars. Matplotlib also allows us to plot horizontal error bars using the xerr parameter.
import matplotlib.pyplot as plt
import numpy as np

x = np.arange(0, 10, 1)
y = np.sin(x)
error = 0.1

plt.errorbar(x, y, xerr=error, fmt='-o')
plt.show()
Output:
By setting the xerr parameter, we can add horizontal error bars to the plot.
Customizing error bar markers
We can customize the markers at data points by specifying parameters in the fmt argument. Let’s look at some examples of customizing error bar markers.
Changing marker size
We can change the size of the markers at data points using the markersize parameter.
import matplotlib.pyplot as plt
import numpy as np

x = np.arange(0, 10, 1)
y = np.sin(x)
error = 0.1

plt.errorbar(x, y, yerr=error, fmt='-o', markersize=10)
plt.show()
Output:
In this code snippet, we set the size of the markers to 10 by specifying markersize=10.
Changing marker color
We can change the color of the markers by setting the markerfacecolor parameter.
import matplotlib.pyplot as plt
import numpy as np

x = np.arange(0, 10, 1)
y = np.sin(x)
error = 0.1

plt.errorbar(x, y, yerr=error, fmt='-o', markerfacecolor='green')
plt.show()
Output:
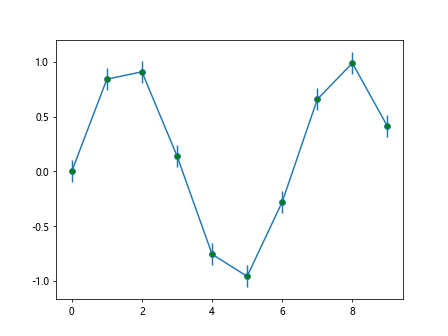
In this example, we set the color of the markers to green by specifying markerfacecolor='green'.
Changing marker style
We can change the style of the markers by setting the marker parameter.
import matplotlib.pyplot as plt
import numpy as np

x = np.arange(0, 10, 1)
y = np.sin(x)
error = 0.1

plt.errorbar(x, y, yerr=error, fmt='-o', marker='s')
plt.show()
In this code snippet, we change the marker style to squares by specifying marker='s'.
plt errorbar style Conclusion
In this article, we have explored various styles of error bars using Matplotlib’s errorbar function. By customizing parameters such as color, line style, and marker style, we can create informative and visually appealing plots that effectively communicate the uncertainty in our data. Experiment with different styles and parameters to find the most suitable error bar style for your data visualization needs.