Pyplot Errorbar Style
In this article, we will discuss how to customize the style of error bars in Matplotlib pyplot. Error bars are graphical representations of the variability of data and are used to indicate the uncertainty or error associated with each data point. By customizing the style of error bars, we can make our plots more informative and visually appealing.
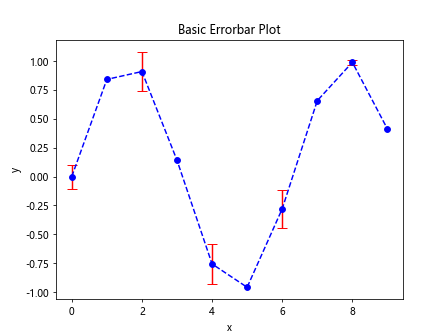
Basic Errorbar Style
Let’s start by creating a basic errorbar plot using Matplotlib.
import matplotlib.pyplot as plt
import numpy as np
x = np.arange(10)
y = np.sin(x)
error = np.random.rand(10) * 0.2
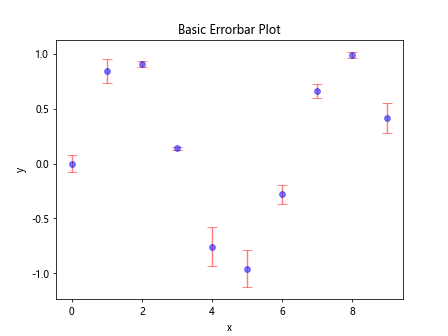
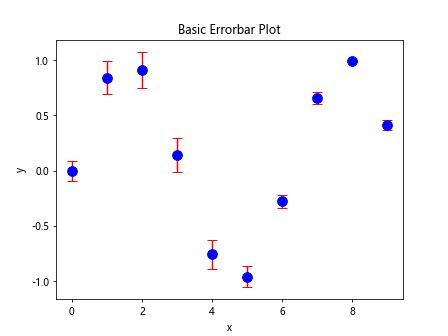
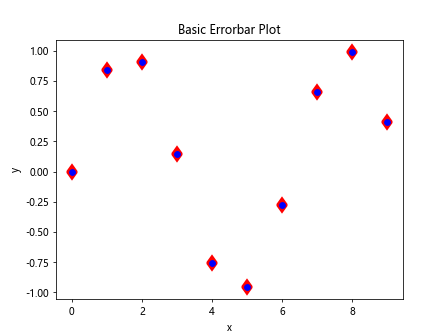
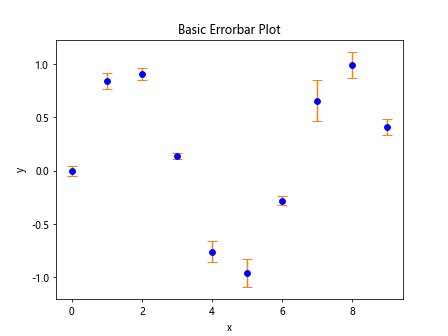
plt.errorbar(x, y, yerr=error, fmt='o', color='blue', ecolor='red', capsize=5)
plt.xlabel('x')
plt.ylabel('y')
plt.title('Basic Errorbar Plot')
plt.show()
Output:
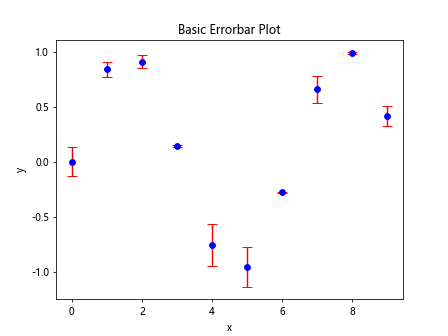
In this example, we use the plt.errorbar function to create an errorbar plot with blue data points, red error bars, and a capsize of 5. The fmt='o' argument specifies that we want to plot the data points as circles.
Changing Errorbar Style
We can customize the style of error bars by changing the line properties and error bar properties.
Changing Line Properties
import matplotlib.pyplot as plt
import numpy as np
x = np.arange(10)
y = np.sin(x)
error = np.random.rand(10) * 0.2
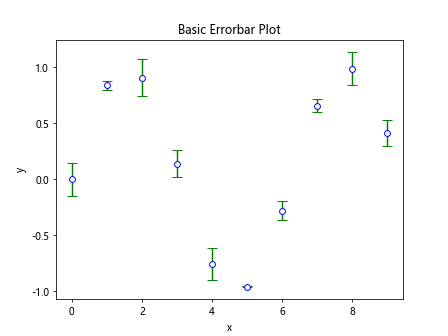
plt.errorbar(x, y, yerr=error, fmt='o-', color='green', ecolor='orange', capsize=3)
plt.xlabel('x')
plt.ylabel('y')
plt.title('Basic Errorbar Plot')
plt.show()
Output:
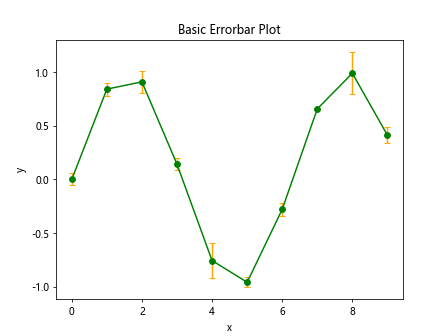
In this example, we use the fmt='o-' argument to plot the data points as circles connected by a line. We also change the color of the data points to green and the color of the error bars to orange.
Changing Error Bar Properties
import matplotlib.pyplot as plt
import numpy as np

x = np.arange(10)
y = np.sin(x)
error = np.random.rand(10) * 0.2

plt.errorbar(x, y, yerr=error, fmt='o', color='purple', ecolor='yellow', capsize=7, elinewidth=2, barsabove=True)
plt.xlabel('x')
plt.ylabel('y')
plt.title('Basic Errorbar Plot')
plt.show()
Output:
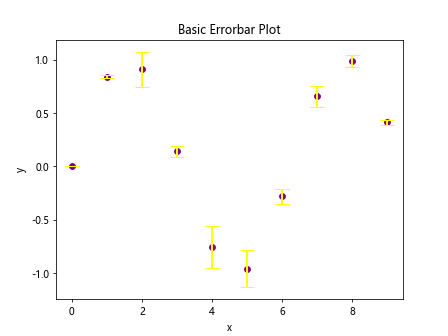
In this example, we increase the width of the error bars using the elinewidth argument and place the error bars above the data points using the barsabove=True argument. We also change the color of the data points to purple and the color of the error bars to yellow.
Custom Errorbar Marker Style
We can customize the marker style of the data points in the errorbar plot.
import matplotlib.pyplot as plt
import numpy as np
x = np.arange(10)
y = np.sin(x)
error = np.random.rand(10) * 0.2
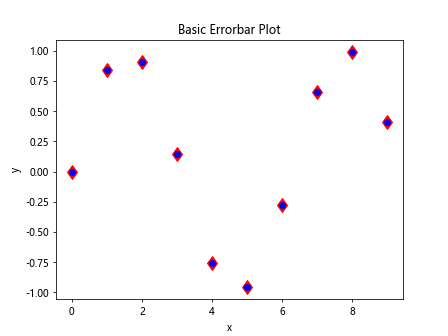
plt.errorbar(x, y, yerr=error, fmt='o', marker='s', color='blue', ecolor='red', capsize=5)
plt.xlabel('x')
plt.ylabel('y')
plt.title('Basic Errorbar Plot')
plt.show()
In this example, we use the marker='s' argument to change the marker style of the data points to squares.
Errorbar Width and Cap Size
We can also adjust the width of the error bars and the size of the caps.
import matplotlib.pyplot as plt
import numpy as np

x = np.arange(10)
y = np.sin(x)
error = np.random.rand(10) * 0.2

plt.errorbar(x, y, yerr=error, fmt='o', color='blue', ecolor='red', capsize=10, elinewidth=3)
plt.xlabel('x')
plt.ylabel('y')
plt.title('Basic Errorbar Plot')
plt.show()
Output:
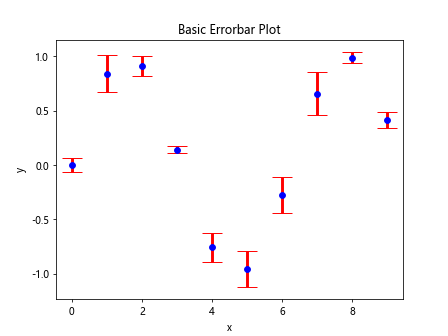
In this example, we increase the cap size of the error bars to 10 and the width of the error bars to 3.
Custom Errorbar Line Style
We can change the line style of the error bars in the plot.
import matplotlib.pyplot as plt
import numpy as np

x = np.arange(10)
y = np.sin(x)
error = np.random.rand(10) * 0.2

plt.errorbar(x, y, yerr=error, fmt='o-', markerfacecolor='white', color='blue', ecolor='red', capsize=5, linestyle='--')
plt.xlabel('x')
plt.ylabel('y')
plt.title('Basic Errorbar Plot')
plt.show()
In this example, we use the linestyle='--' argument to change the line style of the error bars to dashed lines. We also set the marker face color to white.
Errorbar Transparency
We can adjust the transparency of the error bars in the plot.
import matplotlib.pyplot as plt
import numpy as np

x = np.arange(10)
y = np.sin(x)
error = np.random.rand(10) * 0.2

plt.errorbar(x, y, yerr=error, fmt='o', color='blue', ecolor='red', capsize=5, alpha=0.5)
plt.xlabel('x')
plt.ylabel('y')
plt.title('Basic Errorbar Plot')
plt.show()
Output:
In this example, we use the alpha=0.5 argument to set the transparency of the error bars to 50%.
Errorbar Errorbar Width
We can change the width of the error bar caps.
import matplotlib.pyplot as plt
import numpy as np

x = np.arange(10)
y = np.sin(x)
error = np.random.rand(10) * 0.2

plt.errorbar(x, y, yerr=error, fmt='o', color='blue', ecolor='red', capsize=5, capthick=2)
plt.xlabel('x')
plt.ylabel('y')
plt.title('Basic Errorbar Plot')
plt.show()
Output:
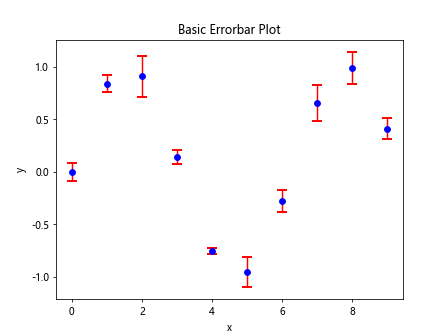
In this example, we use the capthick=2 argument to increase the width of the error bar caps to 2.
Errorbar Direction
We can adjust the direction of the error bars in the plot.
import matplotlib.pyplot as plt
import numpy as np

x = np.arange(10)
y = np.sin(x)
error = np.random.rand(10) * 0.2

plt.errorbar(x, y, yerr=error, fmt='o', color='blue', ecolor='red', capsize=5, uplims=True, lolims=True)
plt.xlabel('x')
plt.ylabel('y')
plt.title('Basic Errorbar Plot')
plt.show()
Output:
In this example, we use the uplims=True and lolims=True arguments to show the upper and lower limits of the error bars.
Custom Errorbar Widths
We can set custom widths for each error bar in the plot.
import matplotlib.pyplot as plt
import numpy as np

x = np.arange(10)
y = np.sin(x)
error = np.random.rand(10) * 0.2

errors = np.random.rand(10) * 0.2
errors[5] = 0.1

plt.errorbar(x, y, yerr=[errors, error], fmt='o', color='blue', ecolor='red', capsize=5)
plt.xlabel('x')
plt.ylabel('y')
plt.title('Basic Errorbar Plot')
plt.show()
Output:
In this example, we create an array errors with custom widths for each error bar. We then use this array to specify different error bar widths for each data point.
Changing Data Marker Size
We can adjust the size of the data markers in the errorbar plot.
import matplotlib.pyplot as plt
import numpy as np

x = np.arange(10)
y = np.sin(x)
error = np.random.rand(10) * 0.2

plt.errorbar(x, y, yerr=error, fmt='o', markersize=10, color='blue', ecolor='red', capsize=5)
plt.xlabel('x')
plt.ylabel('y')
plt.title('Basic Errorbar Plot')
plt.show()
Output:
In this example, we use the markersize=10 argument to increase the size of the data markers to 10.
Changing Errorbar Colors
We can customize the colors of the error bars in the plot.
import matplotlib.pyplot as plt
import numpy as np

x = np.arange(10)
y = np.sin(x)
error = np.random.rand(10) * 0.2

plt.errorbar(x, y, yerr=error, fmt='o', markerfacecolor='white', color='blue', ecolor='green', capsize=5)
plt.xlabel('x')
plt.ylabel('y')
plt.title('Basic Errorbar Plot')
plt.show()
Output:
In this example, we set the color of the data points to blue, the color of the error bars to green, and the marker face color to white.
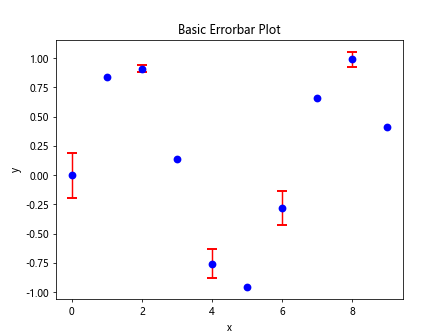
Errorbar Step Patch
We can customize the appearance of the error bars using step patches.
import matplotlib.pyplot as plt
import numpy as np

x = np.arange(10)
y = np.sin(x)
error = np.random.rand(10) * 0.2

plt.errorbar(x, y, yerr=error, fmt='o', color='blue', ecolor='red', capsize=5, errorevery=2)
plt.xlabel('x')
plt.ylabel('y')
plt.title('Basic Errorbar Plot')
plt.show()
Output:
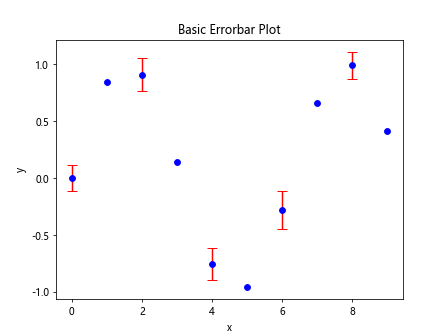
In this example, we use the errorevery=2 argument to show error bars for every other data point.
Custom Errorbar Caps
We can customize the appearance of the error bar caps.
import matplotlib.pyplot as plt
import numpy as np

x = np.arange(10)
y = np.sin(x)
error = np.random.rand(10) * 0.2

plt.errorbar(x, y, yerr=error, fmt='o', color='blue', ecolor='red', capsize=10, capstyle='projecting')
plt.xlabel('x')
plt.ylabel('y')
plt.title('Basic Errorbar Plot')
plt.show()
In this example, we use the capsize=10 argument to increase the size of the error bar caps to 10 and the capstyle='projecting' argument to change the style of the error bar caps.
Supressing Errorbar Caps
We can suppress the display of error bar caps in the plot.
import matplotlib.pyplot as plt
import numpy as np

x = np.arange(10)
y = np.sin(x)
error = np.random.rand(10) * 0.2

plt.errorbar(x, y, yerr=error, fmt='o', color='blue', ecolor='red', capsize=0)
plt.xlabel('x')
plt.ylabel('y')
plt.title('Basic Errorbar Plot')
plt.show()
Output:
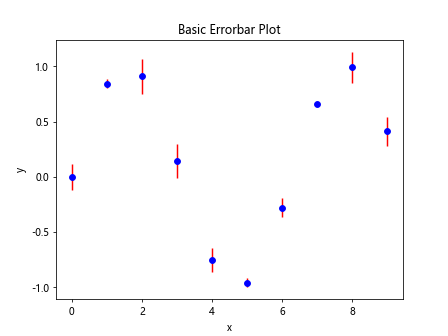
In this example, we use the capsize=0 argument to suppress the display of error bar caps in the plot.
Floating Errorbar Caps
We can create floating error bar caps in the plot.
import matplotlib.pyplot as plt
import numpy as np
x = np.arange(10)
y = np.sin(x)
error = np.random.rand(10) * 0.2
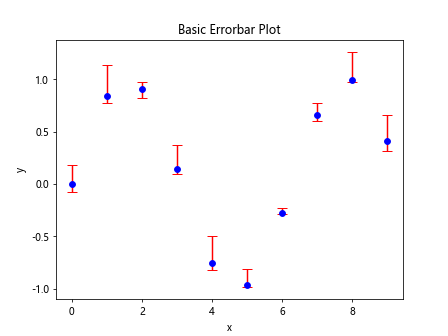
plt.errorbar(x, y, yerr=error, fmt='o', color='blue', ecolor='red', capsize=5, capthick=2, uplims=True, lolims=True)
plt.xlabel('x')
plt.ylabel('y')
plt.title('Basic Errorbar Plot')
plt.show()
Output:
In this example, we use the uplims=True and lolims=True arguments to create floating error bar caps in the plot.
Horizontal Errorbars
We can create horizontal error bars in the plot.
import matplotlib.pyplot as plt
import numpy as np

x = np.arange(10)
y = np.sin(x)
error = np.random.rand(10) * 0.2

plt.errorbar(x, y, xerr=error, fmt='o', color='blue', ecolor='red', capsize=5)
plt.xlabel('x')
plt.ylabel('y')
plt.title('Basic Errorbar Plot')
plt.show()
Output:
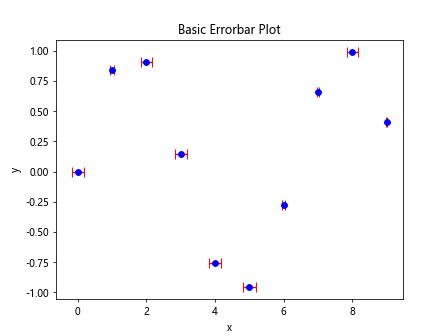
In this example, we use the xerr=error argument to create horizontal error bars in the plot.
Asymmetric Errorbars
We can use asymmetric error bars in the plot.
import matplotlib.pyplot as plt
import numpy as np
x = np.arange(10)
y = np.sin(x)
error = np.random.rand(10) * 0.2
lower_error = np.random.rand(10) * 0.1
upper_error = np.random.rand(10) * 0.3
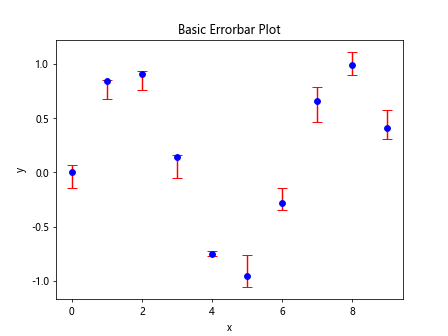
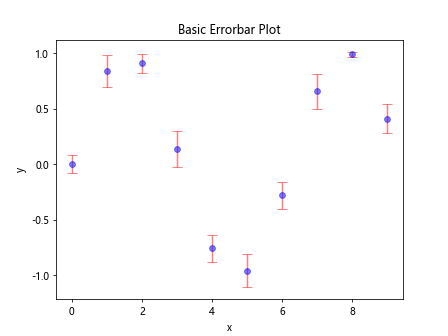
plt.errorbar(x, y, yerr=[lower_error, upper_error], fmt='o', color='blue', ecolor='red', capsize=5)
plt.xlabel('x')
plt.ylabel('y')
plt.title('Basic Errorbar Plot')
plt.show()
Output:
In this example, we create two arrays lower_error and upper_error with different lower and upper error bar values for each data point. We then use these arrays to specify asymmetric error bars in the plot.
Errorbar Alpha Blending
We can use alpha blending to make the error bars semi-transparent.
import matplotlib.pyplot as plt
import numpy as np

x = np.arange(10)
y = np.sin(x)
error = np.random.rand(10) * 0.2

plt.errorbar(x, y, yerr=error, fmt='o', color='blue', ecolor='red', capsize=5, alpha=0.5)
plt.xlabel('x')
plt.ylabel('y')
plt.title('Basic Errorbar Plot')
plt.show()
Output:
In this example, we use the alpha=0.5 argument to apply alpha blending to the error bars, making them semi-transparent.
Errorbar Custom Lines
We can specify custom line styles for the error bars in the plot.
import matplotlib.pyplot as plt
import numpy as np

x = np.arange(10)
y = np.sin(x)
error = np.random.rand(10) * 0.2

plt.errorbar(x, y, yerr=error, fmt='o', color='blue', ecolor='red', capsize=5, errorevery=2, ls='--')
plt.xlabel('x')
plt.ylabel('y')
plt.title('Basic Errorbar Plot')
plt.show()
Output:
In this example, we use the ls='--' argument to specify a dashed line style for the error bars. The errorevery=2 argument is used to show error bars for every other data point.
Errorbar Horizontal and Vertical Caps
We can create error bars with both horizontal and vertical caps in the plot.
import matplotlib.pyplot as plt
import numpy as np

x = np.arange(10)
y = np.sin(x)
error = np.random.rand(10) * 0.2

plt.errorbar(x, y, xerr=error, yerr=error, fmt='o', color='blue', ecolor='red', capsize=5)
plt.xlabel('x')
plt.ylabel('y')
plt.title('Basic Errorbar Plot')
plt.show()
Output:
In this example, we use both xerr=error and yerr=error arguments to create error bars with horizontal and vertical caps.
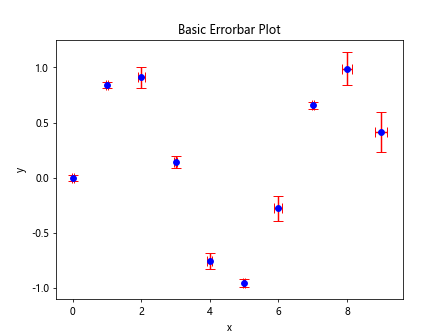
Errorbar Error Marker Thickness
We can adjust the thickness of the error markers in the plot.
import matplotlib.pyplot as plt
import numpy as np

x = np.arange(10)
y = np.sin(x)
error = np.random.rand(10) * 0.2

plt.errorbar(x, y, yerr=error, fmt='o', color='blue', ecolor='red', capsize=5, errorevery=2, markeredgewidth=2)
plt.xlabel('x')
plt.ylabel('y')
plt.title('Basic Errorbar Plot')
plt.show()
Output:
In this example, we use the markeredgewidth=2 argument to increase the thickness of the error markers.
Custom Errorbar Size
We can set custom sizes for the error bars in the plot.
import matplotlib.pyplot as plt
import numpy as np

x = np.arange(10)
y = np.sin(x)
error = np.random.rand(10) * 0.2

plt.errorbar(x, y, yerr=error, fmt='o', color='blue', ecolor='red', capsize=5, elinewidth=2, uplims=True)
plt.xlabel('x')
plt.ylabel('y')
plt.title('Basic Errorbar Plot')
plt.show()
Output:
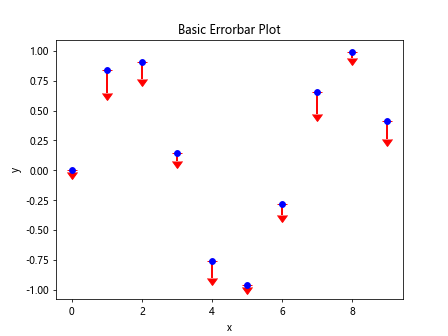
In this example, we use the elinewidth=2 argument to set a custom size for the error bars. The uplims=True argument is used to show only the upper limits of the error bars.
Errorbar Color Cycle
We can set a color cycle for the error bars in the plot.
import matplotlib.pyplot as plt
import numpy as np

x = np.arange(10)
y = np.sin(x)
error = np.random.rand(10) * 0.2

plt.errorbar(x, y, yerr=error, fmt='o', color='blue', ecolor='C1', capsize=5)
plt.xlabel('x')
plt.ylabel('y')
plt.title('Basic Errorbar Plot')
plt.show()
Output:
In this example, we use the ecolor='C1' argument to set the color of the error bars to follow the color cycle specified by 'C1'.
Custom Error Bar Labels
We can add custom labels to the error bars in the plot.
import matplotlib.pyplot as plt
import numpy as np

x = np.arange(10)
y = np.sin(x)
error = np.random.rand(10) * 0.2

plt.errorbar(x, y, yerr=error, fmt='o', color='blue', ecolor='red', capsize=5)
for i, (xi, yi, err) in enumerate(zip(x, y, error)):
    plt.text(xi, yi + err + 0.05, f'{err:.2f}', ha='center')
plt.xlabel('x')
plt.ylabel('y')
plt.title('Basic Errorbar Plot')
plt.show()
Output:
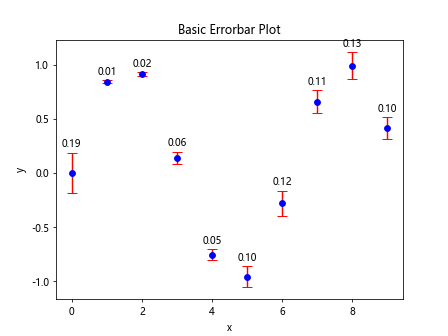
In this example, we use the plt.text function to add custom labels to the error bars showing the error values.
These are just a few examples of how you can customize the style of error bars in Matplotlib pyplot. Experiment with different properties and parameters to create unique and informative errorbar plots for your data visualizations.