plt.errorbar fmt
In Matplotlib, the plt.errorbar() function is used to plot error bars along with a line or marker to represent the data. The fmt argument in the plt.errorbar() function allows you to specify the format of the error bars and the data points.
Basic Usage
The basic usage of plt.errorbar() function with the fmt argument is as follows:
import matplotlib.pyplot as plt

x = [1, 2, 3, 4, 5]
y = [2, 3, 4, 5, 6]
yerr = [0.1, 0.2, 0.1, 0.3, 0.2]

plt.errorbar(x, y, yerr=yerr, fmt='o')
plt.show()
Output:
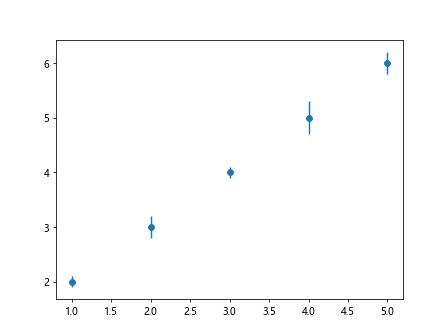
In this example, we have specified the fmt='o' argument in the plt.errorbar() function which indicates that the data points should be plotted as circles.
Customizing Error Bars
You can customize the error bars using different fmt strings. Here are some examples:
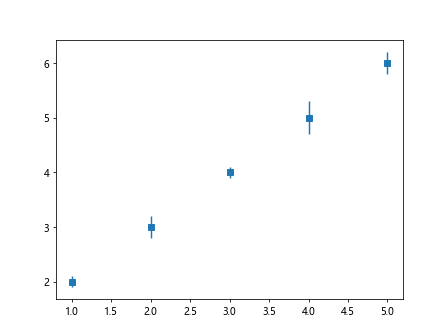
Plotting as Squares:
import matplotlib.pyplot as plt

x = [1, 2, 3, 4, 5]
y = [2, 3, 4, 5, 6]
yerr = [0.1, 0.2, 0.1, 0.3, 0.2]

plt.errorbar(x, y, yerr=yerr, fmt='s')
plt.show()
Output:
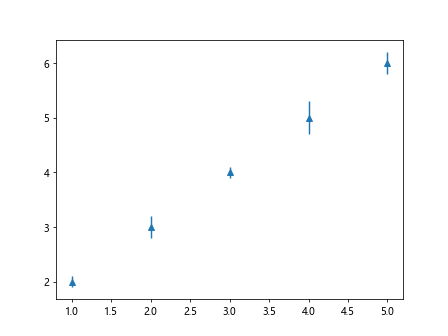
Plotting as Triangles:
import matplotlib.pyplot as plt

x = [1, 2, 3, 4, 5]
y = [2, 3, 4, 5, 6]
yerr = [0.1, 0.2, 0.1, 0.3, 0.2]

plt.errorbar(x, y, yerr=yerr, fmt='^')
plt.show()
Output:
Plotting as Crosses:
import matplotlib.pyplot as plt

x = [1, 2, 3, 4, 5]
y = [2, 3, 4, 5, 6]
yerr = [0.1, 0.2, 0.1, 0.3, 0.2]

plt.errorbar(x, y, yerr=yerr, fmt='x')
plt.show()
Output:

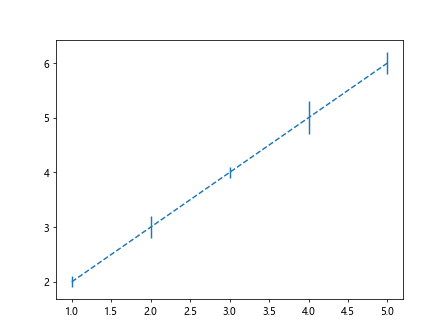
Plotting as Dashed Lines:
import matplotlib.pyplot as plt

x = [1, 2, 3, 4, 5]
y = [2, 3, 4, 5, 6]
yerr = [0.1, 0.2, 0.1, 0.3, 0.2]

plt.errorbar(x, y, yerr=yerr, fmt='--')
plt.show()
Output:
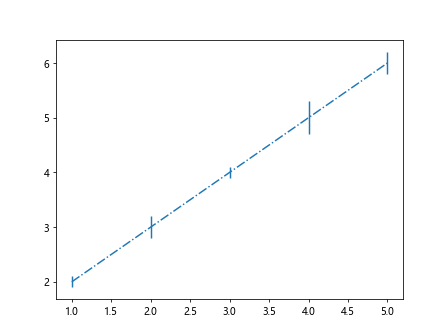
Plotting as Dash-dot Lines:
import matplotlib.pyplot as plt

x = [1, 2, 3, 4, 5]
y = [2, 3, 4, 5, 6]
yerr = [0.1, 0.2, 0.1, 0.3, 0.2]

plt.errorbar(x, y, yerr=yerr, fmt='-.')
plt.show()
Output:
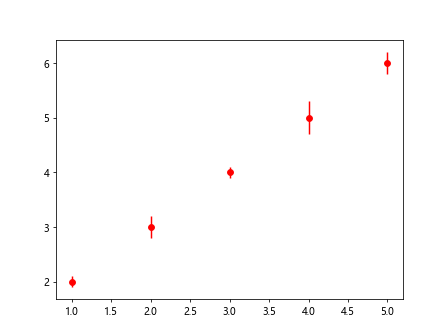
Plotting as Red Circles:
import matplotlib.pyplot as plt

x = [1, 2, 3, 4, 5]
y = [2, 3, 4, 5, 6]
yerr = [0.1, 0.2, 0.1, 0.3, 0.2]

plt.errorbar(x, y, yerr=yerr, fmt='ro')
plt.show()
Output:
Combining Formats
You can also combine different format strings to customize the error bars and data points. Here are some examples:
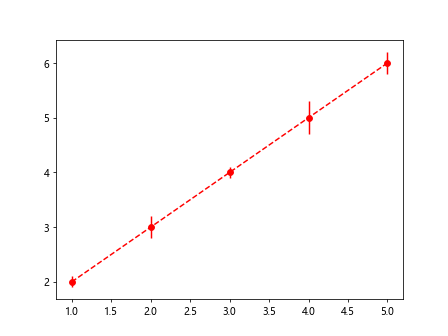
Red Dashed Lines with Circles:
import matplotlib.pyplot as plt

x = [1, 2, 3, 4, 5]
y = [2, 3, 4, 5, 6]
yerr = [0.1, 0.2, 0.1, 0.3, 0.2]

plt.errorbar(x, y, yerr=yerr, fmt='ro--')
plt.show()
Output:
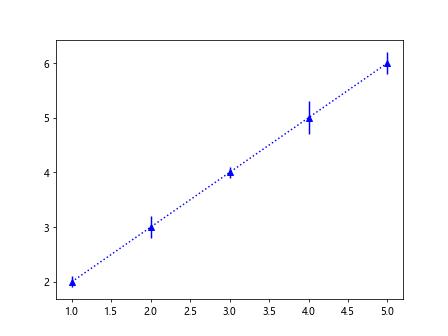
Blue Dotted Lines with Triangles:
import matplotlib.pyplot as plt

x = [1, 2, 3, 4, 5]
y = [2, 3, 4, 5, 6]
yerr = [0.1, 0.2, 0.1, 0.3, 0.2]

plt.errorbar(x, y, yerr=yerr, fmt='b^:')
plt.show()
Output:
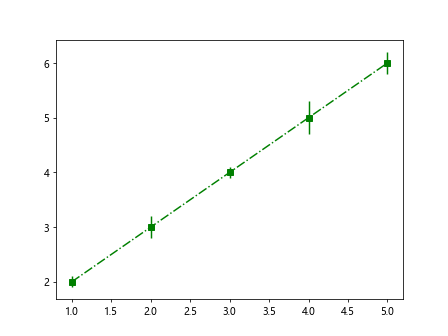
Green Dash-dot Lines with Squares:
import matplotlib.pyplot as plt

x = [1, 2, 3, 4, 5]
y = [2, 3, 4, 5, 6]
yerr = [0.1, 0.2, 0.1, 0.3, 0.2]

plt.errorbar(x, y, yerr=yerr, fmt='gs-.')
plt.show()
Output:
plt.errorbar fmt Conclusion
In this article, we have explored the fmt argument in the plt.errorbar() function in Matplotlib. By specifying different format strings, you can customize the appearance of error bars and data points in your plots. Experiment with different format strings to create visually appealing plots in Matplotlib.