Moving Grid Lines Behind Plot in Matplotlib
One common issue that users face when creating plots in Matplotlib is that the gridlines may obstruct the plot lines or markers, making it difficult to see the actual data. In this guide, we will explore how to move the grid lines behind the plot in Matplotlib to improve the visibility of the data.
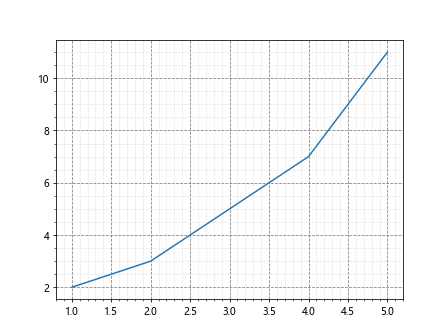
1. Default Plot with Grid Lines
Let’s start by creating a basic line plot with grid lines enabled. By default, the grid lines are placed in front of the plot.
import matplotlib.pyplot as plt

x = [1, 2, 3, 4, 5]
y = [2, 3, 5, 7, 11]

plt.plot(x, y)
plt.grid(True)
plt.show()
Output:
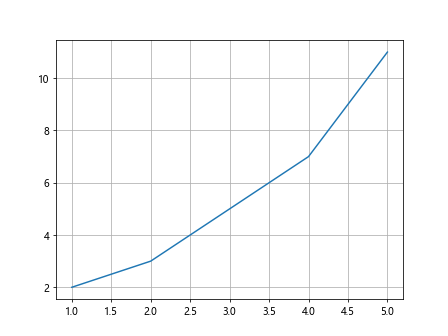
In the above example, you can see that the grid lines are superimposed on top of the plot.
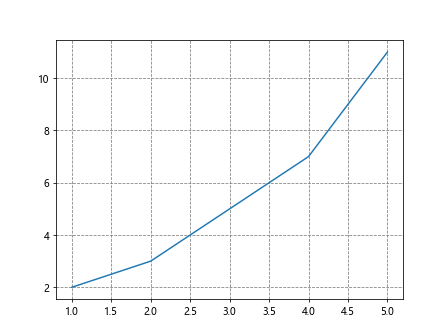
2. Move Grid Lines Behind Plot
To move the grid lines behind the plot, we can adjust the layer order of the grid lines using the zorder parameter. By setting a lower zorder value for the grid lines, they will be placed behind the plot.
import matplotlib.pyplot as plt

x = [1, 2, 3, 4, 5]
y = [2, 3, 5, 7, 11]

plt.plot(x, y)
plt.grid(True, zorder=0)
plt.show()
Output:

Now, the grid lines will be positioned behind the plot, making it easier to visualize the data.
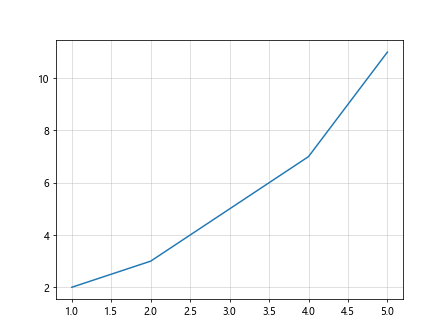
3. Customizing Grid Line Style
You can also customize the style of the grid lines while moving them behind the plot. For example, you can change the color and linestyle of the grid lines.
import matplotlib.pyplot as plt

x = [1, 2, 3, 4, 5]
y = [2, 3, 5, 7, 11]

plt.plot(x, y)
plt.grid(True, zorder=0, color='gray', linestyle='--')
plt.show()
Output:
In this case, the grid lines will be displayed in gray color with a dashed linestyle.
4. Adjusting Grid Line Transparency
Another way to improve the visibility of the plot is by adjusting the transparency of the grid lines. By setting a lower alpha value, the grid lines will appear more subtle.
import matplotlib.pyplot as plt

x = [1, 2, 3, 4, 5]
y = [2, 3, 5, 7, 11]

plt.plot(x, y)
plt.grid(True, zorder=0, alpha=0.5)
plt.show()
Output:
With an alpha value of 0.5, the grid lines will be partially transparent.
5. Moving Major and Minor Grid Lines
You can also move the major and minor grid lines behind the plot independently. This can be useful for creating a clear and organized plot.
import matplotlib.pyplot as plt

x = [1, 2, 3, 4, 5]
y = [2, 3, 5, 7, 11]

plt.plot(x, y)
plt.minorticks_on()
plt.grid(True, which='major', zorder=0)
plt.grid(True, which='minor', zorder=-1)
plt.show()
Output:
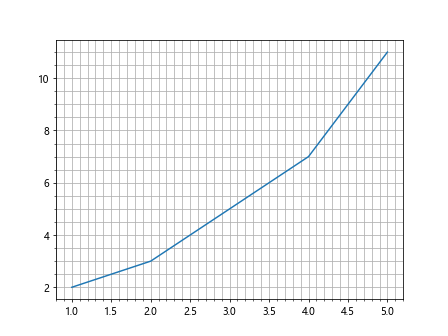
In this example, the major grid lines will be positioned behind the plot, while the minor grid lines will be placed even further back.
6. Customizing Major and Minor Grid Line Styles
Similarly, you can customize the styles of the major and minor grid lines separately. This allows for greater flexibility in designing your plot.
import matplotlib.pyplot as plt

x = [1, 2, 3, 4, 5]
y = [2, 3, 5, 7, 11]

plt.plot(x, y)
plt.minorticks_on()
plt.grid(True, which='major', zorder=0, color='gray', linestyle='--')
plt.grid(True, which='minor', zorder=-1, color='lightgray', linestyle=':')
plt.show()
Output:
Now, the major grid lines will be displayed in gray with a dashed linestyle, while the minor grid lines will be in light gray with a dotted linestyle.
7. Moving Grid Lines Behind Other Plot Elements
In some cases, you may want to move the grid lines behind specific plot elements, such as annotations or legends. By adjusting the zorder value of these elements, you can control their visibility relative to the grid lines.
import matplotlib.pyplot as plt

x = [1, 2, 3, 4, 5]
y = [2, 3, 5, 7, 11]

plt.plot(x, y)
plt.grid(True, zorder=0)
plt.text(3, 8, 'Max Value', zorder=1)
plt.legend(['Data'], loc='upper left', zorder=1)
plt.show()
In this example, the text annotation and legend will be placed in front of the grid lines, ensuring that they are clearly visible.
8. Using Plotly Express
Plotly Express is another powerful data visualization library that allows you to create interactive plots with ease. Let’s see how you can move grid lines behind the plot in Plotly Express.
import plotly.express as px
import matplotlib.pyplot as plt

x = [1, 2, 3, 4, 5]
y = [2, 3, 5, 7, 11]

fig = px.line(x=x, y=y)
fig.update_layout(yaxis=dict(showgrid=True, gridcolor='gray', gridwidth=1, layer='below traces'))
fig.show()
By setting the layer parameter to ‘below traces’, the grid lines will be positioned behind the plot.
9. Comparing Matplotlib and Plotly Express
Let’s compare the same plot created with Matplotlib and Plotly Express to see the differences in grid line placement.
Matplotlib:
import matplotlib.pyplot as plt

x = [1, 2, 3, 4, 5]
y = [2, 3, 5, 7, 11]

plt.plot(x, y)
plt.grid(True, zorder=0, color='gray', linestyle='--')
plt.show()
Output:

Plotly Express:
import matplotlib.pyplot as plt

x = [1, 2, 3, 4, 5]
y = [2, 3, 5, 7, 11]

fig = px.line(x=x, y=y)
fig.update_layout(yaxis=dict(showgrid=True, gridcolor='gray', gridwidth=1, layer='below traces'))
fig.show()
As you can see, both libraries offer options for moving grid lines behind the plot, but the implementation may vary.
10. Conclusion
In this guide, we have explored how to move grid lines behind the plot in Matplotlib to improve the visibility of the data. By adjusting the zorder, color, linestyle, and transparency of the grid lines, you can create clear and aesthetically pleasing plots. Additionally, we have demonstrated how to customize major and minor grid lines separately, as well as how to position grid lines behind specific plot elements. Finally, we have compared the grid line placement in Matplotlib and Plotly Express, showcasing the differences between the two libraries.
Overall, understanding how to manipulate the layer order of grid lines in Matplotlib can enhance the quality of your data visualizations and make your plots more informative and visually appealing.