Plot Vertical Line using Matplotlib
Matplotlib is a popular data visualization library in Python that allows you to create various types of plots with your data. One common task is to plot vertical lines on a graph to mark specific points or regions of interest. In this article, we will explore how to plot vertical lines using Matplotlib.
Basic Vertical Line
To plot a vertical line on a graph using Matplotlib, you can use the axvline function. This function creates a vertical line at a specified x-coordinate. Here is an example code snippet:
import matplotlib.pyplot as plt

x = [1, 2, 3, 4, 5]
y = [2, 3, 5, 7, 11]

plt.plot(x, y)
plt.axvline(x=3, color='r', linestyle='--')
plt.show()
Output:
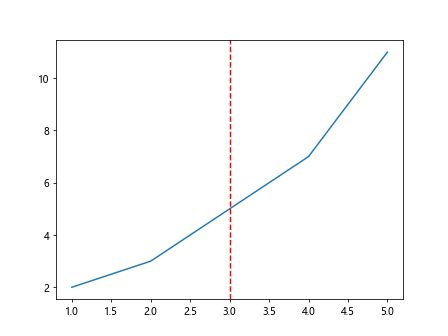
In this code snippet, we first plot a simple line graph with x and y data. Then, we use the axvline function to plot a vertical line at x=3 with a red dashed line style. Running this code will display the graph with the vertical line.
Multiple Vertical Lines
You can also plot multiple vertical lines on the same graph using the axvline function multiple times. Here is an example code snippet:
import matplotlib.pyplot as plt

x = [1, 2, 3, 4, 5]
y = [2, 3, 5, 7, 11]

plt.plot(x, y)
plt.axvline(x=2, color='r', linestyle='--')
plt.axvline(x=4, color='g', linestyle='-.')
plt.show()
Output:
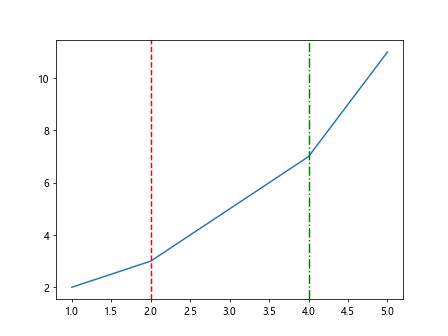
In this example, we plot vertical lines at x=2 and x=4 with different colors and line styles. Running this code will display the graph with two vertical lines.
Customizing Vertical Line Properties
You can customize the properties of the vertical line, such as color, line style, and line width. Here is an example code snippet demonstrating how to customize vertical line properties:
import matplotlib.pyplot as plt

x = [1, 2, 3, 4, 5]
y = [2, 3, 5, 7, 11]

plt.plot(x, y)
plt.axvline(x=3, color='b', linestyle='-', linewidth=2)
plt.show()
Output:
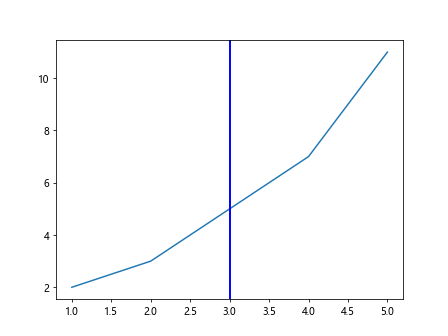
In this code snippet, we plot a vertical line at x=3 with a blue solid line style and a line width of 2. Running this code will display the graph with the customized vertical line.
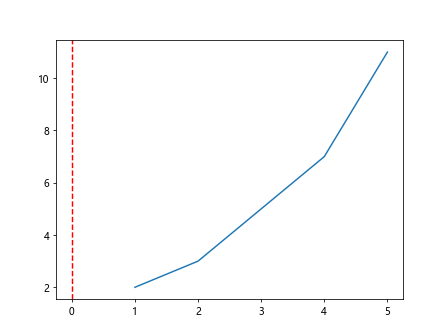
Vertical Line at a Specific Data Point
Sometimes you may want to plot a vertical line at a specific data point rather than a precise x-coordinate. You can achieve this by converting the data point’s x-value to an index and using it as the x-coordinate. Here is an example code snippet:
import matplotlib.pyplot as plt

x = [1, 2, 3, 4, 5]
y = [2, 3, 5, 7, 11]

data_point = 3
index = x.index(data_point)

plt.plot(x, y)
plt.axvline(x=index, color='r', linestyle='--')
plt.show()
Output:
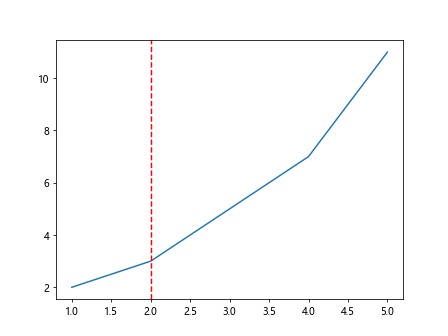
In this code snippet, we plot a vertical line at the data point x=3 by converting the x-value to an index and using it as the x-coordinate for the vertical line.
Vertical Line with Annotations
You can add annotations to vertical lines to provide additional information about the marked point. Here is an example code snippet showing how to add annotations to a vertical line:
import matplotlib.pyplot as plt

x = [1, 2, 3, 4, 5]
y = [2, 3, 5, 7, 11]

plt.plot(x, y)
plt.axvline(x=3, color='r', linestyle='--')
plt.annotate('Vertical Line', xy=(3, 6), xytext=(3.5, 8),
             arrowprops=dict(facecolor='black', shrink=0.05))
plt.show()
Output:
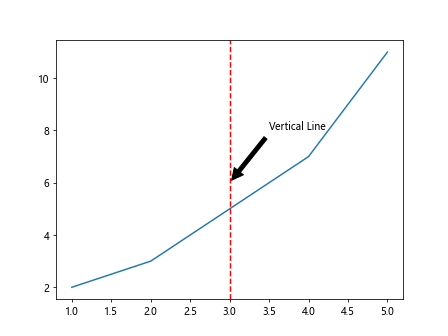
In this example, we add the text ‘Vertical Line’ to the vertical line at x=3 with an arrow pointing to the text. Running this code will display the graph with the annotated vertical line.
Vertical Line with Text
You can also add text labels to vertical lines to further explain the significance of the marked point. Here is an example code snippet illustrating how to add text labels to a vertical line:
import matplotlib.pyplot as plt

x = [1, 2, 3, 4, 5]
y = [2, 3, 5, 7, 11]

plt.plot(x, y)
plt.axvline(x=3, color='r', linestyle='--')
plt.text(3, 6, 'Vertical Line', color='blue', fontsize=12, rotation=90)
plt.show()
Output:
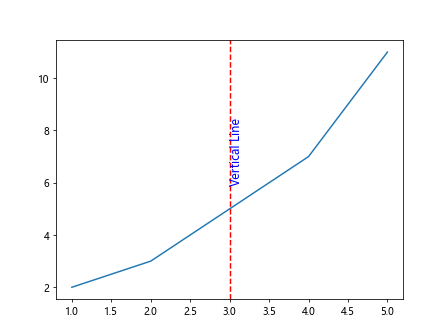
In this code snippet, we add the text ‘Vertical Line’ to the vertical line at x=3 with blue color, font size of 12, and rotated 90 degrees. Running this code will display the graph with the labeled vertical line.
Vertical Line with Transparency
You can adjust the transparency of vertical lines to make them more or less visible on the graph. Here is an example code snippet demonstrating how to set the transparency of a vertical line:
import matplotlib.pyplot as plt

x = [1, 2, 3, 4, 5]
y = [2, 3, 5, 7, 11]

plt.plot(x, y)
plt.axvline(x=3, color='r', linestyle='--', alpha=0.5)
plt.show()
Output:
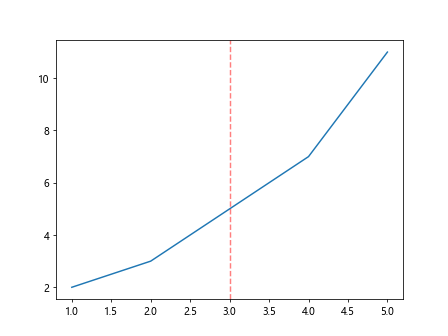
In this example, we plot a vertical line at x=3 with a red dashed line style and a transparency level of 0.5. Running this code will display the graph with the transparent vertical line.
Vertical Line with Infinitely Extended Lines
You can create vertical lines that extend infinitely in both directions to cover the entire y-axis range. Here is an example code snippet showing how to plot a vertical line with infinitely extended lines:
import matplotlib.pyplot as plt

x = [1, 2, 3, 4, 5]
y = [2, 3, 5, 7, 11]

plt.plot(x, y)
plt.axvline(x=3, color='r', linestyle='--', ymin=0, ymax=1)
plt.show()
Output:

In this code snippet, we plot a vertical line at x=3 with a red dashed line style that extends infinitely from the bottom to the top of the graph. Running this code will display the graph with the infinitely extended vertical line.
Vertical Line with Custom Line Label
You can add a custom label to the vertical line to provide descriptive information about the marked point. Here is an example code snippet demonstrating how to add a custom label to a vertical line:
import matplotlib.pyplot as plt

x = [1, 2, 3, 4, 5]
y = [2, 3, 5, 7, 11]

plt.plot(x, y)
vline = plt.axvline(x=3, color='r', linestyle='--')
plt.text(3.1, 6, 'Custom Label', color='black', fontsize=12, rotation=90)
plt.show()
Output:
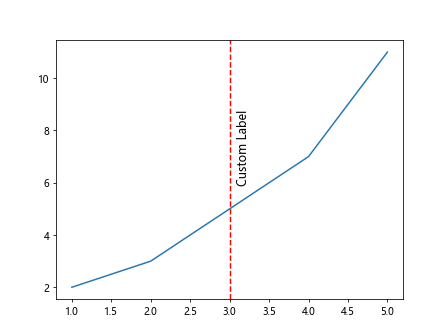
In this code snippet, we plot a vertical line at x=3 with a red dashed line style and add the custom label ‘Custom Label’ next to the vertical line. Running this code will display the graph with the labeled vertical line.
Multiple Vertical Lines with Custom Labels
You can plot multiple vertical lines with custom labels on the same graph to mark various points of interest. Here is an example code snippet showing how to plot multiple vertical lines with custom labels:
import matplotlib.pyplot as plt

x = [1, 2, 3, 4, 5]
y = [2, 3, 5, 7, 11]

plt.plot(x, y)
vline1 = plt.axvline(x=2, color='r', linestyle='--')
vline2 = plt.axvline(x=4, color='g', linestyle='-.')
plt.text(2.1, 6, 'Point A', color='black', fontsize=12, rotation=90)
plt.text(4.1, 6, 'Point B', color='black', fontsize=12, rotation=90)
plt.show()
Output:
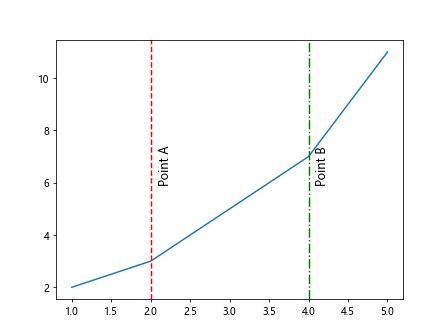
In this example, we plot vertical lines at x=2 and x=4 with custom labels ‘Point A’ and ‘Point B’ next to the vertical lines. Running this code will display the graph with the labeled vertical lines.
Vertical Line with Arrow
You can add an arrow to the vertical line to emphasize the direction of the marked point. Here is an example code snippet illustrating how to add an arrow to a vertical line:
import matplotlib.pyplot as plt

x = [1, 2, 3, 4, 5]
y = [2, 3, 5, 7, 11]

plt.plot(x, y)
plt.axvline(x=3, color='r', linestyle='--')
plt.annotate('Vertical Line with Arrow', xy=(3, 6), xytext=(3.5, 8),
             arrowprops=dict(arrowstyle='->', facecolor='black'))
plt.show()
Output:
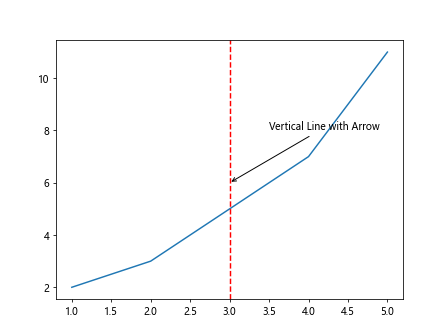
In this code snippet, we add an arrow to the vertical line at x=3 with the text ‘Vertical Line with Arrow’ and an arrow pointing to the text. Running this code will display the graph with the arrowed vertical line.
Vertical Line with Custom Arrow Style
You can customize the style of the arrow added to the vertical line by specifying different arrow properties. Here is an example code snippet demonstrating how to add a vertically oriented arrow to a vertical line with a custom style:
import matplotlib.pyplot as plt

x = [1, 2, 3, 4, 5]
y = [2, 3, 5, 7, 11]

plt.plot(x, y)
plt.axvline(x=3, color='r', linestyle='--')
plt.annotate('Vertical Line with Custom Arrow', xy=(3, 6), xytext=(3.5, 8),
             arrowprops=dict(arrowstyle='-|>', facecolor='black'))
plt.show()
Output:
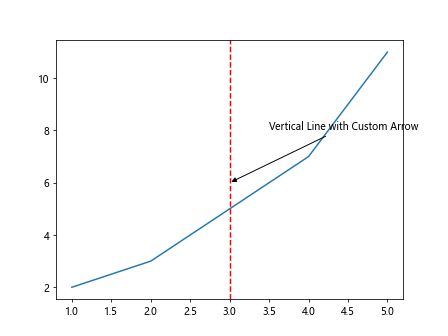
In this example, we add a vertically oriented arrow to the vertical line at x=3 with the text ‘Vertical Line with Custom Arrow’ and a custom arrow style. Running this code will display the graph with the custom arrowed vertical line.
Vertical Line at Maximum Value
You can plot a vertical line at the maximum value of the y-axis to highlight the peak point. Here is an example code snippet showing how to plot a vertical line at the maximum value of the y-axis:
import matplotlib.pyplot as plt

x = [1, 2, 3, 4, 5]
y = [2, 3, 5, 7, 11]

plt.plot(x, y)
max_y = max(y)
index = y.index(max_y)
plt.axvline(x=index, color='r', linestyle='--')
plt.show()
Output:
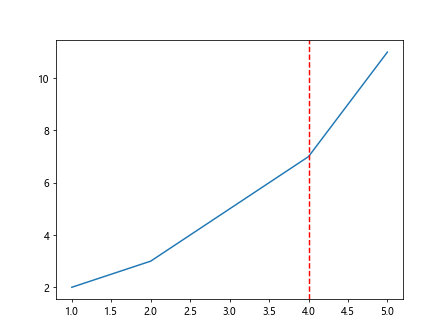
In this code snippet, we plot a vertical line at the maximum value of the y-axis by finding the maximum value and its index and using the index as the x-coordinate for the vertical line.
Vertical Line at Minimum Value
Similarly, you can plot a vertical line at the minimum value of the y-axis to highlight the lowest point. Here is an example code snippet demonstrating how to plot a vertical line at the minimum value of the y-axis:
import matplotlib.pyplot as plt

x = [1, 2, 3, 4, 5]
y = [2, 3, 5, 7, 11]

plt.plot(x, y)
min_y = min(y)
index = y.index(min_y)
plt.axvline(x=index, color='r', linestyle='--')
plt.show()
Output:
In this example, we plot a vertical line at the minimum value of the y-axis by finding the minimum value and its index and using the index as the x-coordinate for the vertical line.
plot vertical line matplotlib Conclusion
In this article, we have explored different ways to plot vertical lines using Matplotlib in Python. We have covered basic vertical lines, multiple vertical lines, customizing vertical line properties, and adding annotations and labels to vertical lines. By using these techniques, you can effectively mark specific points or regions of interest on your graphs. Experiment with the provided code examples to create vertical lines that suit your data visualization needs.