Matplotlib Title
Matplotlib is a powerful plotting library in Python that allows you to create a wide variety of plots and visualizations. One important aspect of a plot is the title, as it helps provide context and information to the viewer. In this article, we will discuss how to add titles to plots in Matplotlib in different scenarios.
Adding a Basic Title to a Plot
The simplest way to add a title to a plot in Matplotlib is by using the title() function. Here is an example code snippet that demonstrates how to add a basic title to a plot:
import matplotlib.pyplot as plt

plt.plot([1, 2, 3, 4], [1, 4, 9, 16])
plt.title('Simple Plot')
plt.show()
Output:
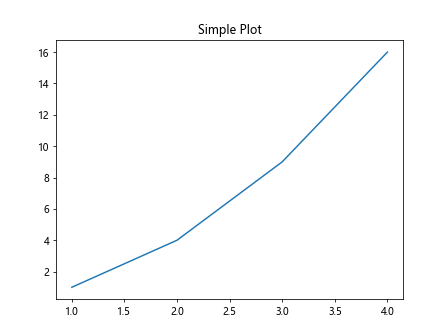
In this example, we create a basic line plot and add a title “Simple Plot” to it using the title() function.
Customizing the Title Appearance
You can customize the appearance of the title by using various parameters such as font size, font weight, font style, and color. Here is an example code snippet that shows how to customize the title appearance:
import matplotlib.pyplot as plt

plt.plot([1, 2, 3, 4], [1, 4, 9, 16])
plt.title('Customized Title', fontsize=20, fontweight='bold', fontstyle='italic', color='r')
plt.show()
Output:
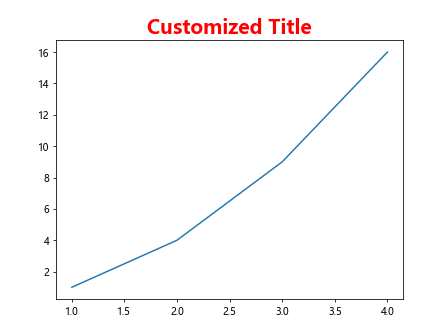
In this example, we customize the title by setting the font size to 20, font weight to bold, font style to italic, and color to red.
Adding a Subtitle to a Plot
You can also add a subtitle to a plot in Matplotlib by using the suptitle() function. Here is an example code snippet that demonstrates how to add a subtitle to a plot:
import matplotlib.pyplot as plt

plt.plot([1, 2, 3, 4], [1, 4, 9, 16])
plt.title('Main Title')
plt.suptitle('Subtitle', fontsize=12, color='b')
plt.show()
Output:
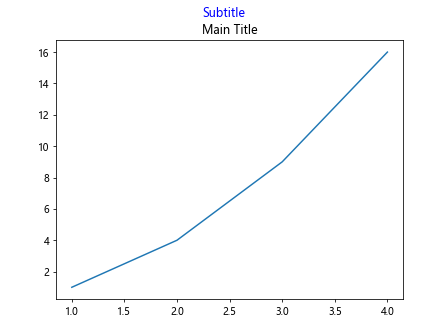
In this example, we add a subtitle “Subtitle” to the plot using the suptitle() function.
Adding Title to Subplots
Sometimes you may want to add titles to individual subplots in a figure. You can achieve this by using the set_title() function. Here is an example code snippet that shows how to add titles to subplots:
import matplotlib.pyplot as plt

fig, axs = plt.subplots(2)
axs[0].plot([1, 2, 3, 4], [1, 4, 9, 16])
axs[0].set_title('First Subplot')
axs[1].plot([1, 2, 3, 4], [1, 8, 27, 64])
axs[1].set_title('Second Subplot')
plt.show()
Output:
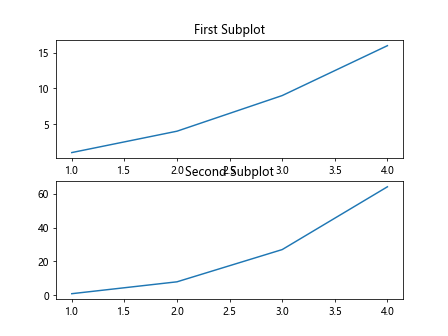
In this example, we create a figure with two subplots and add titles to each subplot using the set_title() function.
Adding Title with LaTeX
Matplotlib supports LaTeX formatting for text, which allows you to create more complex and visually appealing titles. Here is an example code snippet that demonstrates how to add a LaTeX-formatted title to a plot:
import matplotlib.pyplot as plt

plt.plot([1, 2, 3, 4], [1, 4, 9, 16])
plt.title(r'$\frac{a}{b}$', fontsize=16)
plt.show()
Output:
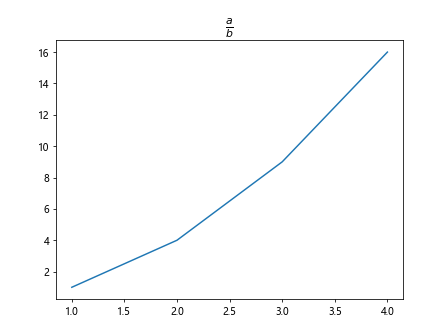
In this example, we add a LaTeX-formatted title representing a fraction “a/b” to the plot.
Adding Location to the Title
You can specify the location of the title within the plot using the loc parameter. Here is an example code snippet that shows how to add a title at the bottom-right corner of the plot:
import matplotlib.pyplot as plt

plt.plot([1, 2, 3, 4], [1, 4, 9, 16])
plt.title('Bottom-Right Title', loc='right')
plt.show()
Output:
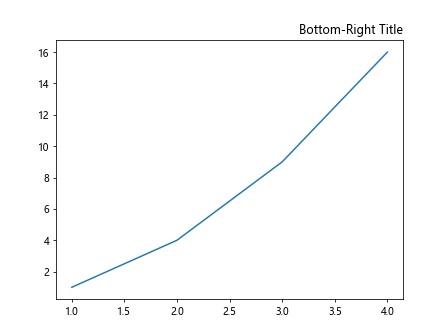
In this example, we add a title “Bottom-Right Title” to the plot and position it at the bottom-right corner using the loc='right' parameter.
Writing Multi-line Titles
If you need to write a multi-line title in Matplotlib, you can use the newline character \n to break the title into multiple lines. Here is an example code snippet that demonstrates how to create a multi-line title:
import matplotlib.pyplot as plt

plt.plot([1, 2, 3, 4], [1, 4, 9, 16])
plt.title('Multi-line\nTitle')
plt.show()
Output:
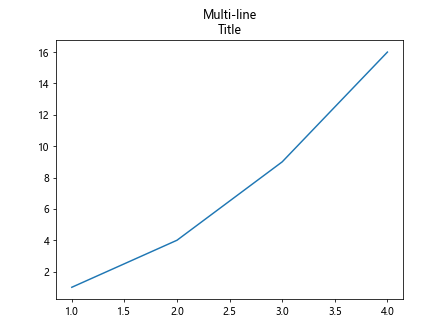
In this example, we create a multi-line title with the first line saying “Multi-line” and the second line saying “Title”.
Adding Title to a Pie Chart
In addition to line plots, you can also add titles to other types of plots like pie charts in Matplotlib. Here is an example code snippet that shows how to add a title to a pie chart:
import matplotlib.pyplot as plt

labels = ['A', 'B', 'C', 'D']
sizes = [25, 30, 25, 20]
plt.pie(sizes, labels=labels, autopct='%1.1f%%')
plt.title('Pie Chart')
plt.show()
Output:
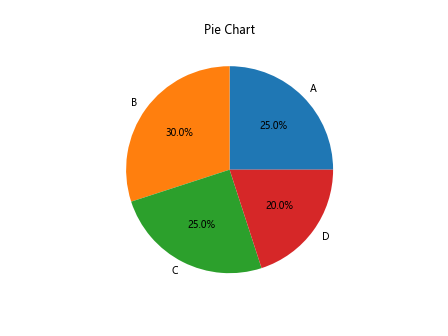
In this example, we create a pie chart and add a title “Pie Chart” to it.
Customizing the Title Position
You can also customize the position of the title within the plot using the x and y parameters. Here is an example code snippet that demonstrates how to position the title at a specific location:
import matplotlib.pyplot as plt

plt.plot([1, 2, 3, 4], [1, 4, 9, 16])
plt.title('Custom Position Title', x=0.5, y=0.9)
plt.show()
Output:
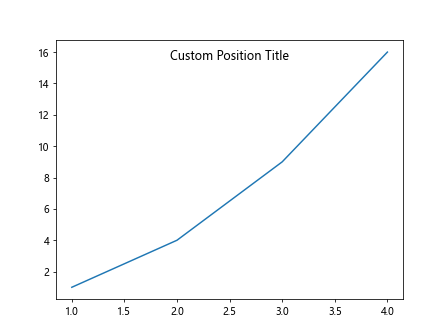
In this example, we position the title “Custom Position Title” at coordinates (0.5, 0.9) within the plot.
Adding a Description to the Title
Sometimes you may want to provide additional information or a description along with the title. You can achieve this by including the description within the title string. Here is an example code snippet that shows how to add a description to the title:
import matplotlib.pyplot as plt

plt.plot([1, 2, 3, 4], [1, 4, 9, 16])
plt.title('Main Title\nDescription: This plot shows the relationship between x and y')
plt.show()
Output:
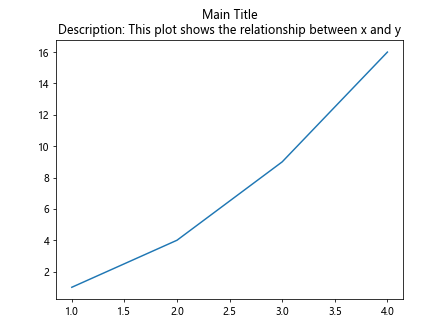
In this example, we add a description “This plot shows the relationship between x and y” below the main title in the plot.
Matplotlib Title Conclusion
In this article, we discussed various ways to add titles to plots in Matplotlib, including basic titles, customized appearance, subtitles, subplots, LaTeX formatting, location specification, multi-line titles, title for pie charts, and custom position and description. Titles are important for providing context and information to viewers, and Matplotlib provides a flexible and easy-to-use interface for adding titles to plots. Experiment with different title styles and formats to create visually appealing plots for your data visualization needs.