Matplotlib Vertical Line
Matplotlib is a popular library in Python used for creating interactive plots and visualizations. In this article, we will explore how to draw vertical lines in a Matplotlib plot. Drawing vertical lines can be useful in various scenarios such as indicating important values, highlighting certain points in a plot, or simply for aesthetic purposes.
Basic Vertical Line
Let’s start by creating a basic plot and adding a vertical line to it. We will use the plt.vlines() function to draw a vertical line at x=2.
import matplotlib.pyplot as plt

# Create some data
x = [1, 2, 3, 4, 5]
y = [2, 3, 5, 7, 6]

# Plot the data
plt.plot(x, y)

# Add a vertical line at x=2
plt.vlines(x=2, ymin=0, ymax=8, colors='r', linestyles='dashed')

# Show the plot
plt.show()
Output:
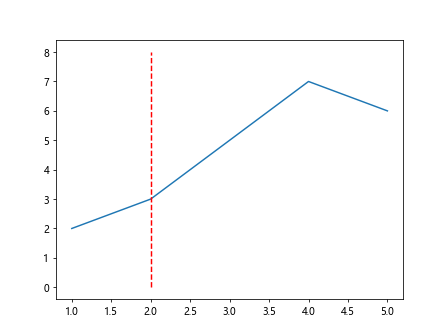
In this example, we use the plt.vlines() function with parameters x=2 to indicate the position of the vertical line, ymin=0 to set the start point of the line, ymax=8 to set the end point of the line, colors='r' to set the color of the line, and linestyles='dashed' to set the style of the line.
Adding Multiple Vertical Lines
You can also add multiple vertical lines to a plot by passing a list of x-values to the plt.vlines() function.
import matplotlib.pyplot as plt

# Create some data
x = [1, 2, 3, 4, 5]
y = [2, 3, 5, 7, 6]

# Plot the data
plt.plot(x, y)

# Add vertical lines at x=2 and x=4
plt.vlines(x=[2, 4], ymin=0, ymax=8, colors=['r', 'b'], linestyles='dashed')

# Show the plot
plt.show()
Output:
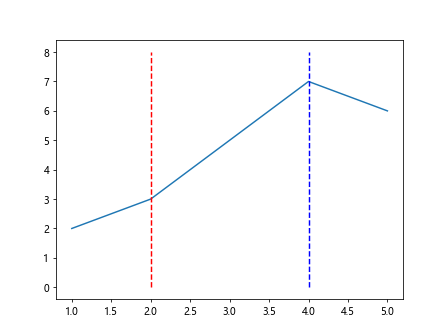
In this example, we pass a list [2, 4] to the x parameter of plt.vlines() to add vertical lines at x=2 and x=4.
Customizing Vertical Lines
You can customize the appearance of vertical lines by changing parameters such as color, linestyle, and line width.
import matplotlib.pyplot as plt

# Create some data
x = [1, 2, 3, 4, 5]
y = [2, 3, 5, 7, 6]

# Plot the data
plt.plot(x, y)

# Add a vertical line with custom parameters
plt.vlines(x=3, ymin=0, ymax=8, colors='purple', linestyles='dashdot', linewidth=2)

# Show the plot
plt.show()
Output:
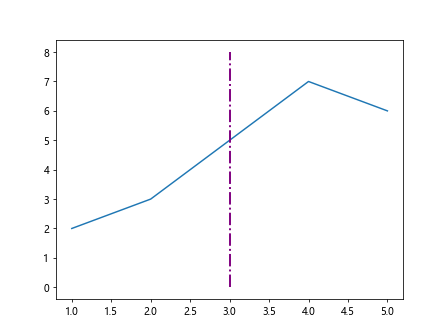
In this example, we use the parameters colors='purple', linestyles='dashdot', and linewidth=2 to customize the appearance of the vertical line.
Using Annotations with Vertical Lines
You can also add annotations to vertical lines to provide additional information. Annotations can include text labels, arrows, and other elements.
import matplotlib.pyplot as plt

# Create some data
x = [1, 2, 3, 4, 5]
y = [2, 3, 5, 7, 6]

# Plot the data
plt.plot(x, y)

# Add a vertical line at x=3 with an annotation
plt.vlines(x=3, ymin=0, ymax=8, colors='green', linestyles='dotted')
plt.annotate('Vertical Line', xy=(3, 6), xytext=(4, 7),
             arrowprops=dict(facecolor='black', shrink=0.05))

# Show the plot
plt.show()
Output:
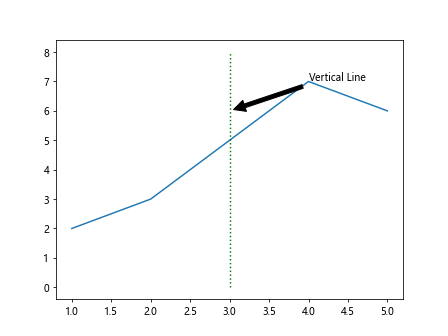
In this example, we use the plt.annotate() function to add an annotation to the vertical line at x=3. The xy=(3, 6) parameter sets the position of the annotation, xytext=(4, 7) sets the position of the text, and arrowprops=dict(facecolor='black', shrink=0.05) adds an arrow to the annotation.
Adding Vertical Lines to Subplots
You can also add vertical lines to subplots in Matplotlib. Subplots allow you to create multiple plots within the same figure.
import matplotlib.pyplot as plt

# Create some data
x = [1, 2, 3, 4, 5]
y1 = [1, 2, 3, 4, 5]
y2 = [5, 4, 3, 2, 1]

# Create a figure with two subplots
fig, axs = plt.subplots(2)

# Plot data on the first subplot
axs[0].plot(x, y1)
axs[0].vlines(x=2, ymin=0, ymax=6, colors='r', linestyles='dashed')

# Plot data on the second subplot
axs[1].plot(x, y2)
axs[1].vlines(x=3, ymin=0, ymax=6, colors='b', linestyles='dotted')

# Show the plot
plt.show()
Output:
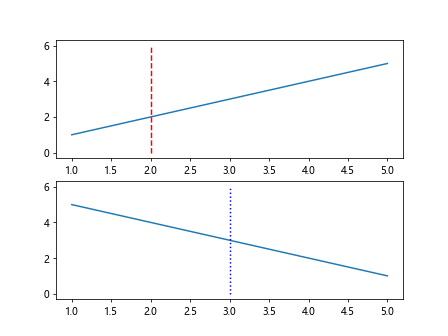
In this example, we create a figure with two subplots using the plt.subplots() function. We then plot different data on each subplot and add vertical lines at x=2 to the first subplot and x=3 to the second subplot.
Vertical Line with Date Axis
If you are working with time series data, you may need to add vertical lines with datetime x-axis values. You can achieve this by converting datetime objects to numerical values using Matplotlib’s dates module.
import matplotlib.pyplot as plt
import numpy as np
import pandas as pd

# Generate some random time series data
dates = pd.date_range('20220101', periods=5)
values = np.random.randint(1, 10, size=5)

# Plot the data
plt.plot(dates, values)

# Add a vertical line at a specific date
plt.vlines(x=pd.Timestamp('20220103'), ymin=0, ymax=10, colors='purple', linestyles='dashdot')

# Show the plot
plt.show()
Output:
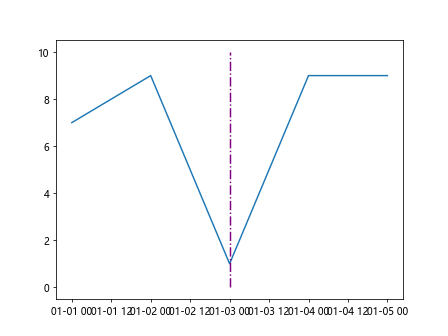
In this example, we use pandas to generate random time series data with dates and values. We then add a vertical line at a specific date ‘20220103’ using the pd.Timestamp() function.
Combine Multiple Types of Lines in a Plot
You can combine multiple types of lines in a single plot, such as horizontal and vertical lines, to enhance the visualization.
import matplotlib.pyplot as plt

# Create some data
x = [1, 2, 3, 4, 5]
y = [2, 3, 5, 7, 6]

# Plot the data
plt.plot(x, y)

# Add a vertical line at x=3 and a horizontal line at y=5
plt.vlines(x=3, ymin=0, ymax=8, colors='purple', linestyles='dashdot')
plt.hlines(y=5, xmin=1, xmax=5, colors='orange', linestyles='dotted')

# Show the plot
plt.show()
Output:
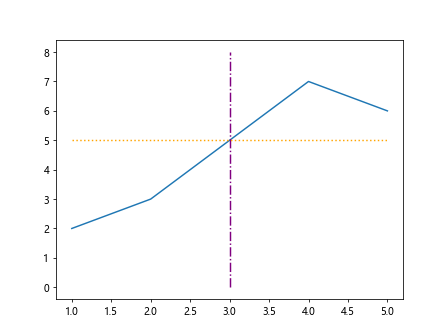
In this example, we use both plt.vlines() and plt.hlines() functions to add a vertical line at x=3 and a horizontal line at y=5 in the plot.
Using a Loop to Draw Multiple Vertical Lines
You can use a loop to draw multiple vertical lines at different x-values in a plot. This is useful when you have a list of values that you want to highlight.
import matplotlib.pyplot as plt

# Create some data
x = [1, 2, 3, 4, 5]
y = [2, 3, 5, 7, 6]
highlight_values = [2, 4]

# Plot the data
plt.plot(x, y)

# Add vertical lines at specific x-values using a loop
for highlight_value in highlight_values:
    plt.vlines(x=highlight_value, ymin=0, ymax=8, colors='purple', linestyles='dashdot')

# Show the plot
plt.show()
Output:
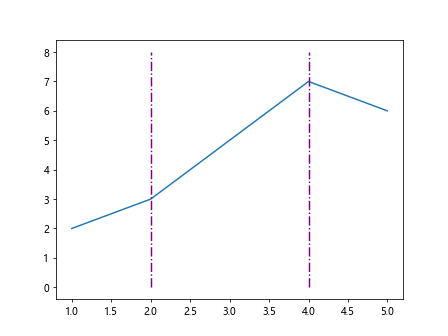
In this example, we define a list highlight_values containing the x-values we want to highlight with vertical lines. We then use a loop to iterate over each value in the list and draw a vertical line at that x-value.
Conditional Vertical Lines
You can add vertical lines based on certain conditions in your data. For example, you may want to add vertical lines when the value exceeds a certain threshold.
import matplotlib.pyplot as plt
import numpy as np

# Generate some random data
x = np.linspace(0, 10, 100)
y = np.sin(x)

# Plot the data
plt.plot(x, y)

# Add a vertical line when y > 0.5
threshold = 0.5
for i in range(len(x)):
    if y[i] > threshold:
        plt.vlines(x=x[i], ymin=-1, ymax=1, colors='red', linestyles='dotted')

# Show the plot
plt.show()
Output:
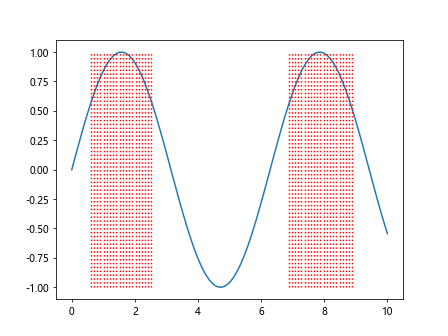
In this example, we generate random data and plot a sine wave. We then use a loop to iterate over each data point and add a vertical line when the y-value exceeds a threshold of 0.5.
Vertical Line with Annotations
You can combine vertical lines with annotations to provide context or additional information about the data point being highlighted.
import matplotlib.pyplot as plt
import numpy as np

# Generate some random data
x = np.linspace(0, 10, 100)
y = np.sin(x)

# Plot the data
plt.plot(x, y)

# Add a vertical line at x=3 with an annotation
plt.vlines(x=3, ymin=-1, ymax=1, colors='green', linestyles='dotted')
plt.annotate('Threshold', xy=(3, 0.5), xytext=(4, 0.7),
             arrowprops=dict(facecolor='black', shrink=0.05))

# Show the plot
plt.show()
Output:
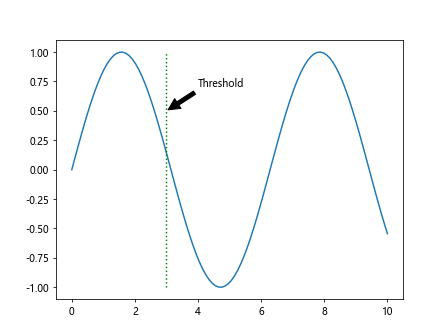
In this example, we add a vertical line at x=3 and an annotation ‘Threshold’ to provide additional information about the data point.
Customizing Vertical Line Annotations
You can customize the annotations on vertical lines by changing font size, font color, rotation, and other text properties.
import matplotlib.pyplot as plt

# Create some data
x = [1, 2, 3, 4, 5]
y = [2, 3, 5, 7, 6]

# Plot the data
plt.plot(x, y)

# Add a vertical line at x=4 with a customized annotation
plt.vlines(x=4, ymin=0, ymax=8, colors='blue', linestyles='dotted')
plt.annotate('Custom Annotation', xy=(4, 6), xytext=(5, 7),
             arrowprops=dict(facecolor='black', shrink=0.05),
             fontsize=12, color='red', rotation=45)

# Show the plot
plt.show()
Output:
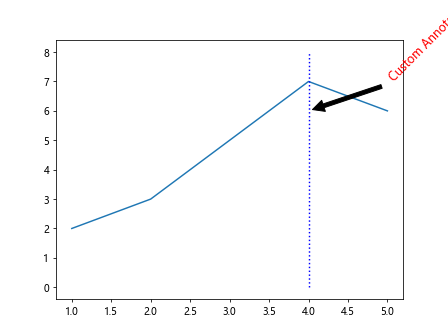
In this example, we customize the annotation ‘Custom Annotation’ on the vertical line at x=4 by changing the font size to 12, the font color to 'red', and rotating the text by 45 degrees.
Vertical Line with Transparent Area
You can highlight a specific region in the plot by adding a vertical line with a transparent area around it.
import matplotlib.pyplot as plt

# Create some data
x = [1, 2, 3, 4, 5]
y = [2, 3, 5, 7, 6]

# Plot the data
plt.plot(x, y)

# Add a vertical line at x=3 with a transparent area
plt.axvline(x=3, color='green', linestyle='dashed', alpha=0.5)
plt.axvspan(xmin=2.5, xmax=3.5, color='green', alpha=0.3)

# Show the plot
plt.show()
Output:
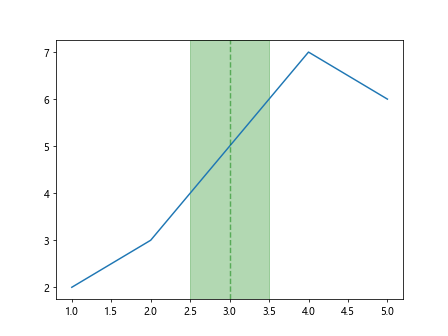
In this example, we add a vertical line at x=3 with a dashed style and transparency of 0.5. We also add a transparent area around the vertical line using plt.axvspan() with xmin=2.5, xmax=3.5, color='green', and alpha=0.3.
Vertical Line with Text Label
You can add text labels to vertical lines to provide context or information about the line.
import matplotlib.pyplot as plt
import numpy as np

# Generate some data
x = np.linspace(0, 10, 100)
y = np.sin(x)

# Plot the data
plt.plot(x, y)

# Add a vertical line at x=3 with a text label
plt.vlines(x=3, ymin=-1, ymax=1, colors='blue', linestyles='dashdot')
plt.text(3, 0, 'Vertical Line', color='blue', fontsize=12, rotation=90, va='bottom')

# Show the plot
plt.show()
Output:
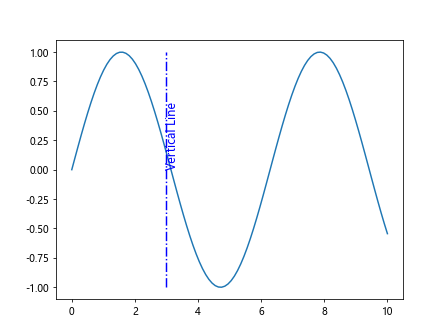
In this example, we add a vertical line at x=3 with the label ‘Vertical Line’ using plt.text(). We customize the text color to 'blue', font size to 12, rotation to 90 degrees, and vertical alignment to 'bottom'.
Vertical Line with Arrows
You can add arrows to vertical lines to emphasize a specific point or highlight important information in the plot.
import matplotlib.pyplot as plt

# Create some data
x = [1, 2, 3, 4, 5]
y = [2, 3, 5, 7, 6]

# Plot the data
plt.plot(x, y)

# Add a vertical line at x=4 with an arrow
plt.vlines(x=4, ymin=0, ymax=8, colors='purple', linestyles='dotted')
plt.annotate('Vertical Line with Arrow', xy=(4, 6), xytext=(5, 7),
             arrowprops=dict(arrowstyle='->', color='black'))

# Show the plot
plt.show()
Output:
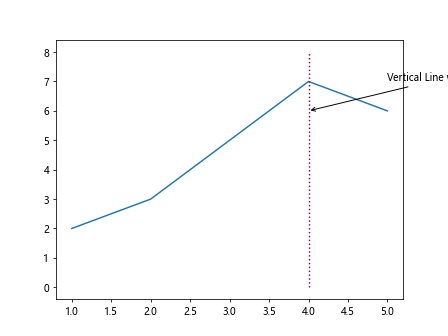
In this example, we add a vertical line at x=4 with the label ‘Vertical Line with Arrow’ and an arrow pointing to the line using arrowprops=dict(arrowstyle='->', color='black').
Matplotlib Vertical Line Conclusion
In this article, we explored how to draw vertical lines in Matplotlib plots. Vertical lines are a useful tool for indicating important values, highlighting specific points, or adding visual elements to your plots. We covered various aspects of adding vertical lines, including basic lines, multiple lines, customizing appearance, using annotations, working with subplots, and adding lines based on conditions. By using the examples provided in this article, you can enhance the visualizations in your Matplotlib plots and effectively communicate your data.