Matplotlib set figure size
Matplotlib is a powerful plotting library for Python that allows you to create a wide variety of charts and graphs. One common task when using Matplotlib is setting the figure size, which determines the dimensions of the plot. In this article, we will explore how to set figure size in Matplotlib and provide some examples to demonstrate different ways to do this.
Example 1: Set figure size using figure function
You can use the figure function to create a new figure with a specified size. Here is an example of how to set the figure size to 10 inches by 6 inches:
import matplotlib.pyplot as plt

plt.figure(figsize=(10, 6))
plt.plot([1, 2, 3, 4], [1, 4, 9, 16])
plt.show()
Output:
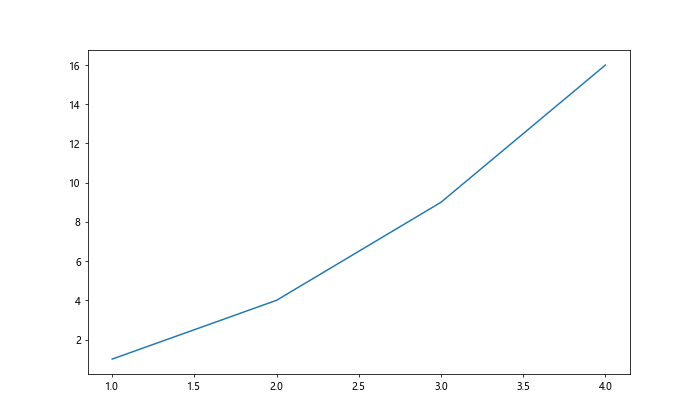
In this example, we use the figsize parameter in the figure function to set the dimensions of the figure.
Example 2: Set figure size using rcParams configuration
Another way to set the figure size globally for all plots is by configuring the default figure size using rcParams. Here is an example of how to set the figure size to 8 inches by 8 inches:
import matplotlib.pyplot as plt
import matplotlib as mpl

mpl.rcParams['figure.figsize'] = (8, 8)

plt.plot([1, 2, 3, 4], [1, 4, 9, 16])
plt.show()
Output:
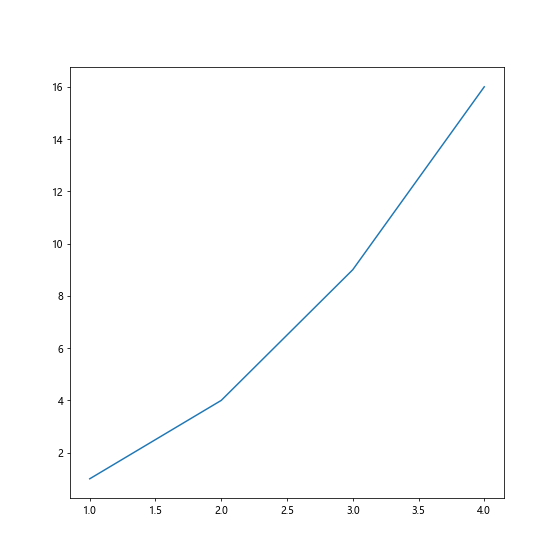
In this example, we modify the figure.figsize parameter in rcParams to set the default figure size for all plots.
Example 3: Set figure size using subplots function
You can also set the figure size when creating subplots using the subplots function. Here is an example of how to set the figure size to 12 inches by 4 inches for a subplot with 2 rows and 1 column:
import matplotlib.pyplot as plt

fig, axs = plt.subplots(2, 1, figsize=(12, 4))
axs[0].plot([1, 2, 3, 4], [1, 4, 9, 16])
axs[1].plot([1, 2, 3, 4], [1, 2, 3, 4])
plt.show()
Output:
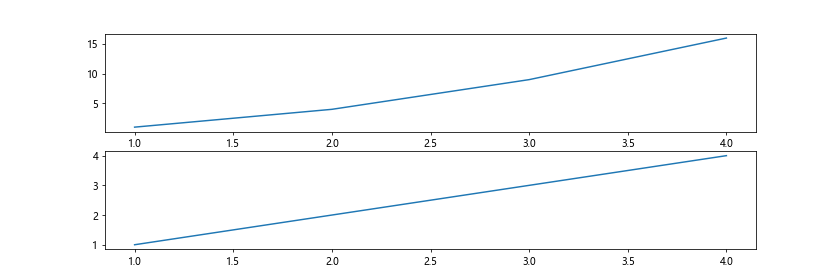
In this example, we use the figsize parameter in the subplots function to set the figure size for the subplots.
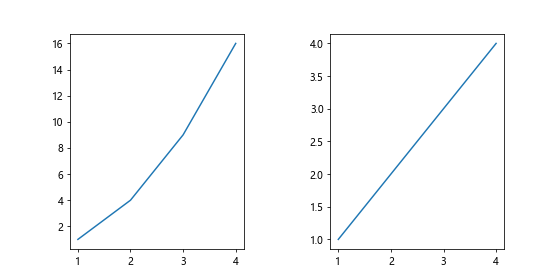
Example 4: Set figure size for different subplots
You can set different figure sizes for different subplots by specifying the size for each subplot. Here is an example of setting different figure sizes for two subplots:
import matplotlib.pyplot as plt

fig, axs = plt.subplots(1, 2, figsize=(8, 4))
axs[0].plot([1, 2, 3, 4], [1, 4, 9, 16])
axs[1].plot([1, 2, 3, 4], [1, 2, 3, 4])

fig.set_size_inches(12, 6)
plt.show()
Output:
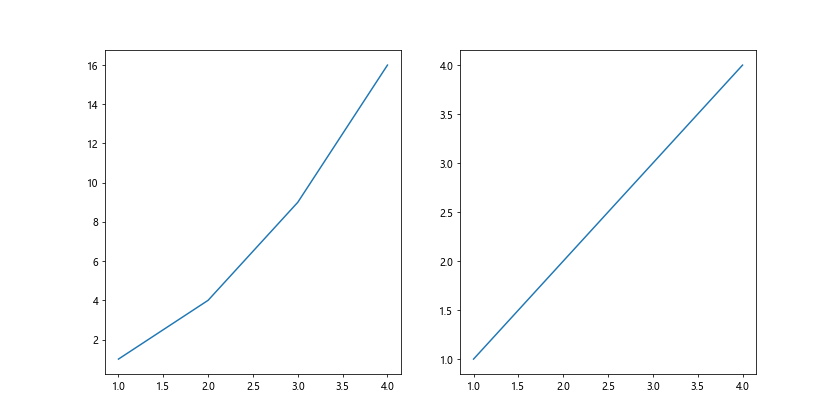
In this example, we set the initial figure size for both subplots using the subplots function, then adjust the figure size for the entire figure using set_size_inches method.
Example 5: Set figure size for different subplots with padding
You can also set the figure size for different subplots while adding padding between them. Here is an example of setting the figure size for two subplots with padding:
import matplotlib.pyplot as plt

fig, axs = plt.subplots(1, 2, figsize=(8, 4), gridspec_kw={'wspace': 0.5})
axs[0].plot([1, 2, 3, 4], [1, 4, 9, 16])
axs[1].plot([1, 2, 3, 4], [1, 2, 3, 4])

plt.show()
Output:
In this example, we set the figure size for the subplots using the figsize parameter in the subplots function and add padding between subplots using gridspec_kw parameter.
Example 6: Set figure size using rcParams for multiple plots
You can set the figure size globally using rcParams for multiple plots in a script. Here is an example of setting the figure size to 10 inches by 8 inches for multiple plots:
import matplotlib.pyplot as plt
import matplotlib as mpl

mpl.rcParams['figure.figsize'] = (10, 8)

plt.subplot(1, 2, 1)
plt.plot([1, 2, 3, 4], [1, 4, 9, 16])

plt.subplot(1, 2, 2)
plt.plot([1, 2, 3, 4], [1, 2, 3, 4])

plt.show()
Output:
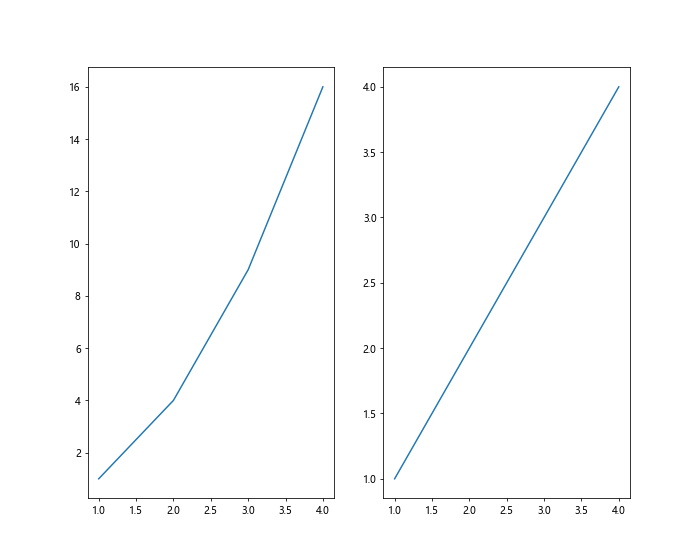
In this example, we modify the figure.figsize parameter in rcParams to set the default figure size for all plots in the script.
Example 7: Set figure size for a specific plot
You can also set the figure size for a specific plot by creating a new figure and setting its size. Here is an example of setting the figure size to 6 inches by 4 inches for a specific plot:
import matplotlib.pyplot as plt

fig = plt.figure(figsize=(6, 4))
plt.plot([1, 2, 3, 4], [1, 4, 9, 16])
plt.show()
Output:
In this example, we create a new figure with a specified size to set the figure size for a specific plot.
Example 8: Aspect ratio of figure
You can also control the aspect ratio of the figure by setting the size of the figure. Here is an example of setting the figure size to 6 inches by 4 inches with an aspect ratio of 1:1:
import matplotlib.pyplot as plt

fig = plt.figure(figsize=(6, 6))
plt.plot([1, 2, 3, 4], [1, 4, 9, 16])
plt.show()
Output:
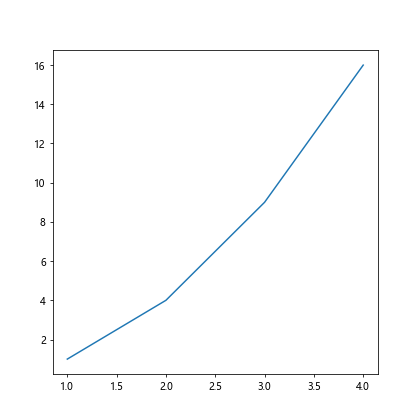
In this example, we set the width and height of the figure to be the same to create a figure with a 1:1 aspect ratio.
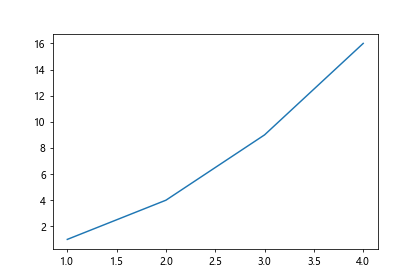
Example 9: Adjust figure size after plotting
You can adjust the figure size after plotting by using the set_size_inches method. Here is an example of adjusting the figure size to 8 inches by 6 inches after plotting:
import matplotlib.pyplot as plt

plt.plot([1, 2, 3, 4], [1, 4, 9, 16])
plt.gcf().set_size_inches(8, 6)
plt.show()
Output:
In this example, we use the set_size_inches method on the current figure (gcf) to adjust the figure size after plotting.
Example 10: Save figure with specified size
You can also save a figure with a specified size by setting the figure size before saving it. Here is an example of saving a figure with a size of 8 inches by 6 inches:
import matplotlib.pyplot as plt

plt.plot([1, 2, 3, 4], [1, 4, 9, 16])
plt.gcf().set_size_inches(8, 6)
plt.savefig('figure.png')
In this example, we set the figure size before saving the figure as an image file.
By using the examples provided in this article, you can easily set the figure size in Matplotlib for your plots and customize the dimensions of your figures to suit your needs. Whether you want to set the figure size for all plots globally or for specific plots, Matplotlib offers several ways to control the size of your figures and create visually appealing visualizations.