What line of code will import matplotlib
Matplotlib is a popular Python library used for creating static, animated, and interactive visualizations. In this article, we will explore how to import matplotlib into a Python script or Jupyter notebook.
Importing matplotlib in Python script
To import matplotlib in a Python script, you can use the following line of code:
import matplotlib.pyplot as plt
Here, matplotlib.pyplot is a module within the matplotlib library that provides a MATLAB-like interface for creating plots. By importing matplotlib.pyplot as plt, you can access its functions and classes using the plt prefix.
Example 1:
import matplotlib.pyplot as plt

plt.plot([1, 2, 3, 4], [5, 6, 7, 8])
plt.show()
Output:

In this example, we import matplotlib.pyplot as plt and use the plot function to create a simple line plot. The show function is then used to display the plot.
Example 2:
import matplotlib.pyplot as plt
import numpy as np

x = np.linspace(0, 10, 100)
y = np.sin(x)

plt.plot(x, y)
plt.show()
Output:

In this example, we also import the numpy library as np to create an array of x-values using np.linspace and y-values using np.sin. We then plot the sine curve using the plot function.
Importing matplotlib in Jupyter notebook
To import matplotlib in a Jupyter notebook, you can use the following line of code:
%matplotlib inline
import matplotlib.pyplot as plt
Here, %matplotlib inline is a magic command that allows plots to be displayed directly in the notebook, and matplotlib.pyplot is imported as plt in the same way as in a Python script.
Example 3:
%matplotlib inline
import matplotlib.pyplot as plt

plt.plot([1, 2, 3, 4], [5, 6, 7, 8])
plt.show()
In this example, we use the magic command %matplotlib inline to display the plot inline in the notebook.
Example 4:
%matplotlib inline
import matplotlib.pyplot as plt
import numpy as np

x = np.linspace(0, 10, 100)
y = np.sin(x)

plt.plot(x, y)
plt.show()
In this example, we import the numpy library as np and create a sine curve plot similar to Example 2.
Customizing matplotlib plots
Matplotlib provides a wide range of options for customizing plots, including setting plot styles, colors, labels, and formatting. Let’s explore some examples of customizing matplotlib plots using code.
Example 5: Setting plot title and labels
import matplotlib.pyplot as plt

plt.plot([1, 2, 3, 4], [5, 6, 7, 8])
plt.title('Simple Line Plot')
plt.xlabel('X-axis')
plt.ylabel('Y-axis')
plt.show()
Output:
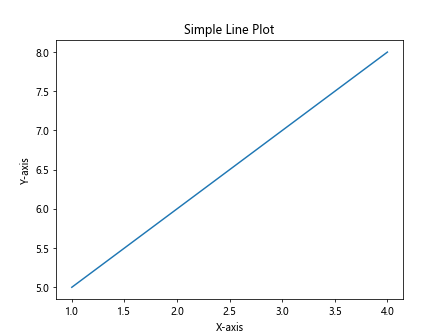
In this example, we add a title to the plot using the title function and set the x and y-axis labels using the xlabel and ylabel functions.
Example 6: Changing plot style and color
import matplotlib.pyplot as plt

plt.plot([1, 2, 3, 4], [5, 6, 7, 8], linestyle='--', color='red')
plt.show()
Output:

In this example, we change the line style to a dashed line using the linestyle argument and the line color to red using the color argument.
Example 7: Adding grid lines to the plot
import matplotlib.pyplot as plt

plt.plot([1, 2, 3, 4], [5, 6, 7, 8])
plt.grid(True)
plt.show()
Output:

In this example, we add grid lines to the plot using the grid function with the argument True.
Example 8: Changing the plot size
import matplotlib.pyplot as plt

plt.figure(figsize=(8, 6))
plt.plot([1, 2, 3, 4], [5, 6, 7, 8])
plt.show()
Output:

In this example, we change the plot size to 8×6 inches using the figure function with the figsize argument.
Example 9: Plotting multiple lines on the same plot
import matplotlib.pyplot as plt

plt.plot([1, 2, 3, 4], [5, 6, 7, 8], label='Line 1')
plt.plot([1, 2, 3, 4], [8, 7, 6, 5], label='Line 2')
plt.legend()
plt.show()
Output:

In this example, we plot two lines on the same plot and add a legend using the legend function.
Saving matplotlib plots to a file
Matplotlib allows you to save plots to various file formats, such as PNG, PDF, and SVG. Let’s see how to save a matplotlib plot to a file using code.
Example 10: Saving plot as a PNG file
import matplotlib.pyplot as plt

plt.plot([1, 2, 3, 4], [5, 6, 7, 8])
plt.savefig('plot.png')
In this example, we save the plot to a PNG file named plot.png using the savefig function.
Example 11: Saving plot as a PDF file
import matplotlib.pyplot as plt

plt.plot([1, 2, 3, 4], [5, 6, 7, 8])
plt.savefig('plot.pdf')
In this example, we save the plot to a PDF file named plot.pdf.
Example 12: Saving plot as a SVG file
import matplotlib.pyplot as plt

plt.plot([1, 2, 3, 4], [5, 6, 7, 8])
plt.savefig('plot.svg')
In this example, we save the plot to an SVG file named plot.svg.
What line of code will import matplotlib Conclusion
In this article, we explored how to import matplotlib into a Python script or Jupyter notebook using the line of code import matplotlib.pyplot as plt. We also looked at examples of customizing matplotlib plots, saving plots to files, and using matplotlib in a Jupyter notebook. Matplotlib is a powerful library for creating various types of plots and visualizations, and with these examples, you should be able to get started with using matplotlib in your projects.