Matplotlib Multiple Lines
Matplotlib is a popular Python library used for creating static, animated, and interactive visualizations in Python. One common use case in Matplotlib is plotting multiple lines in a single figure. In this article, we will explore various ways to plot multiple lines using Matplotlib.
Basic Line Plot with Multiple Lines
In this example, we will create a basic line plot with multiple lines. We will plot two lines showing the cosine and sine functions.
import matplotlib.pyplot as plt
import numpy as np

x = np.linspace(0, 2*np.pi, 100)
y1 = np.cos(x)
y2 = np.sin(x)

plt.plot(x, y1, label='Cosine')
plt.plot(x, y2, label='Sine')
plt.legend()
plt.show()
Output:
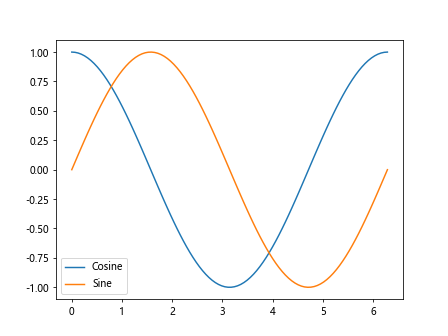
In this code snippet, we use plt.plot() to plot two lines representing the cosine and sine functions. We add labels to the lines using the label parameter and display the legend with plt.legend().
Setting Line Colors and Styles
You can customize the appearance of each line by setting colors and line styles. In the following example, we will plot two lines with different colors and line styles.
import matplotlib.pyplot as plt
import numpy as np

x = np.linspace(0, 2*np.pi, 100)
y1 = np.cos(x)
y2 = np.sin(x)

plt.plot(x, y1, color='red', linestyle='--', label='Cosine')
plt.plot(x, y2, color='blue', linestyle=':', label='Sine')
plt.legend()
plt.show()
Output:
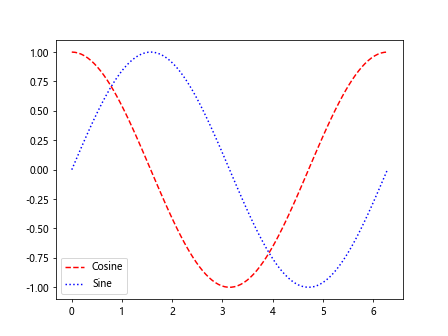
Here, we specify the line color using the color parameter and the line style using the linestyle parameter.
Adding Markers to Data Points
You can also add markers to data points on the lines to highlight specific points. In this example, we will plot two lines with markers for the data points.
import matplotlib.pyplot as plt
import numpy as np

x = np.linspace(0, 2*np.pi, 20)
y1 = np.cos(x)
y2 = np.sin(x)

plt.plot(x, y1, marker='o', label='Cosine')
plt.plot(x, y2, marker='s', label='Sine')
plt.legend()
plt.show()
Output:
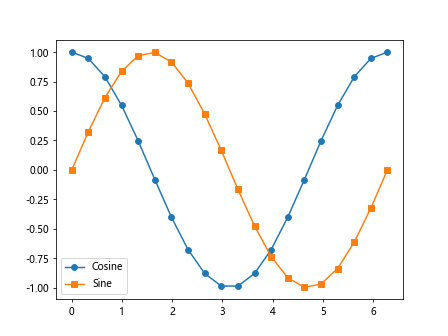
The marker parameter is used to specify the type of marker to use for the data points.
Customizing Line Width
You can adjust the line width to make the lines more prominent. In the following example, we will plot two lines with different line widths.
import matplotlib.pyplot as plt
import numpy as np

x = np.linspace(0, 2*np.pi, 100)
y1 = np.cos(x)
y2 = np.sin(x)

plt.plot(x, y1, linewidth=2, label='Cosine')
plt.plot(x, y2, linewidth=1, label='Sine')
plt.legend()
plt.show()
Output:
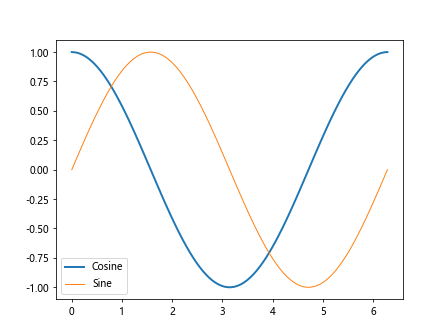
The linewidth parameter is used to control the width of the lines.
Adding Annotations
You can annotate specific points on the plot to provide additional information. In this example, we will add text annotations to specific points on the lines.
import matplotlib.pyplot as plt
import numpy as np

x = np.linspace(0, 2*np.pi, 100)
y1 = np.cos(x)
y2 = np.sin(x)

plt.plot(x, y1, label='Cosine')
plt.plot(x, y2, label='Sine')

plt.text(2, 0.5, 'Peak', fontsize=12, ha='left')
plt.text(4, -0.5, 'Valley', fontsize=12, ha='right')

plt.legend()
plt.show()
Output:
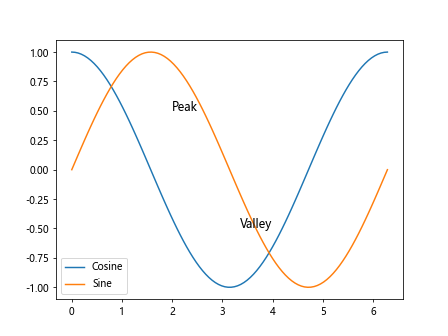
We use plt.text() to add text annotations to specific coordinates on the plot.
Multi-line Plot with Different Line Styles
In this example, we will create a multi-line plot with different line styles for each line.
import matplotlib.pyplot as plt
import numpy as np

x = np.linspace(0, 2*np.pi, 100)
y1 = np.cos(x)
y2 = np.sin(x)
y3 = np.tan(x)

plt.plot(x, y1, linestyle='-', label='Cosine')
plt.plot(x, y2, linestyle='--', label='Sine')
plt.plot(x, y3, linestyle='-.', label='Tangent')
plt.legend()
plt.show()
Output:
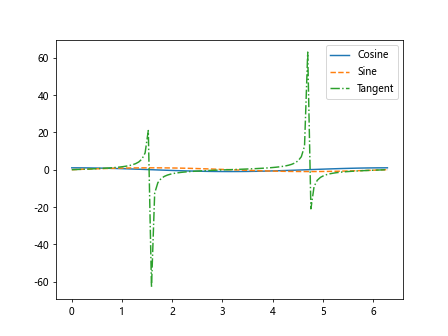
Here, we plot three lines with different line styles using the linestyle parameter.
Adjusting Line Transparencies
You can adjust the transparency of the lines to control their visibility. In this example, we will plot two lines with different transparencies.
import matplotlib.pyplot as plt
import numpy as np

x = np.linspace(0, 2*np.pi, 100)
y1 = np.cos(x)
y2 = np.sin(x)

plt.plot(x, y1, alpha=0.7, label='Cosine')
plt.plot(x, y2, alpha=0.3, label='Sine')
plt.legend()
plt.show()
Output:
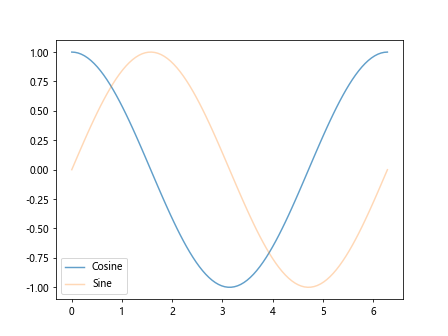
The alpha parameter is used to adjust the transparency of the lines, with values closer to 1 being more opaque and values closer to 0 being more transparent.
Plotting a Scatter Plot with Line of Best Fit
In this example, we will create a scatter plot with data points and plot a line of best fit through the data using plt.plot().
import matplotlib.pyplot as plt
import numpy as np

x = np.array([1, 2, 3, 4, 5])
y = np.array([2, 3, 4, 5, 6])

plt.scatter(x, y, label='Data Points')
plt.plot(np.unique(x), np.poly1d(np.polyfit(x, y, 1))(np.unique(x)), color='red', label='Line of Best Fit')
plt.legend()
plt.show()
Output:
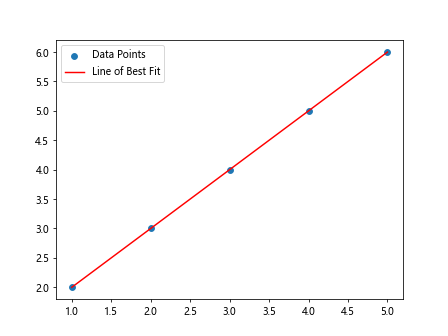
Here, we use plt.scatter() to plot the data points and np.polyfit() to calculate the line of best fit.
Stacked Line Plot
You can create a stacked line plot by plotting multiple lines on top of each other. In this example, we will create a stacked line plot with three lines.
import matplotlib.pyplot as plt
import numpy as np

x = np.linspace(0, 2*np.pi, 100)
y1 = np.cos(x)
y2 = np.sin(x)
y3 = np.tan(x)

plt.plot(x, y1, label='Cosine')
plt.plot(x, y1+y2, label='Cosine + Sine')
plt.plot(x, y1+y2+y3, label='Total')
plt.legend()
plt.show()
Output:
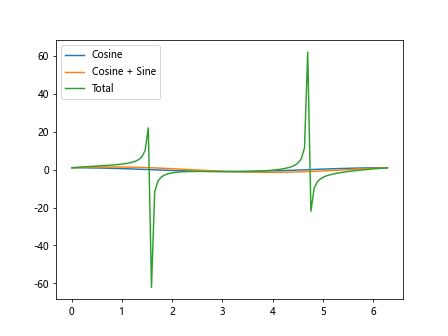
Here, we plot the cosine, cosine plus sine, and total values as stacked lines.
Subplots with Multiple Lines
You can create subplots with multiple lines to compare different datasets. In this example, we will create subplots with two rows and two columns, each containing multiple lines.
import matplotlib.pyplot as plt
import numpy as np

fig, axs = plt.subplots(2, 2, figsize=(10, 8))

x = np.linspace(0, 2*np.pi, 100)
y1 = np.cos(x)
y2 = np.sin(x)
y3 = np.tan(x)

axs[0, 0].plot(x, y1, label='Cosine')
axs[0, 1].plot(x, y2, label='Sine')
axs[1, 0].plot(x, y3, label='Tangent')
axs[1, 1].plot(x, y1+y2+y3, label='Total')

plt.tight_layout()
plt.show()
Output:
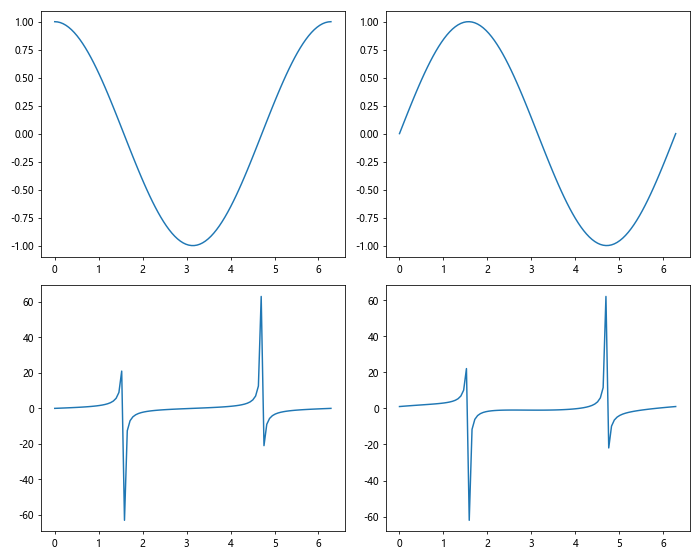
Here, we create a 2×2 grid of subplots and plot different lines in each subplot.
Customizing Axis Labels and Title
You can customize the axis labels and title of the plot for better readability. In this example, we will add axis labels and a title to the plot.
import matplotlib.pyplot as plt
import numpy as np

x = np.linspace(0, 2*np.pi, 100)
y = np.sin(x)

plt.plot(x, y)
plt.xlabel('X-axis')
plt.ylabel('Y-axis')
plt.title('Sine Function')
plt.show()
Output:
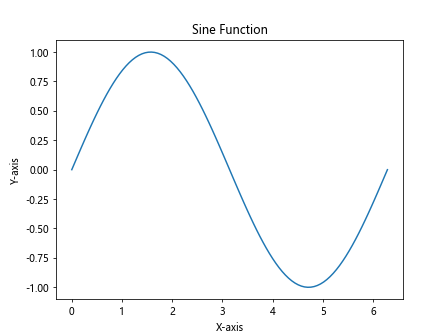
The plt.xlabel(), plt.ylabel(), and plt.title() functions are used to add axis labels and a title to the plot.
Multiple Lines with Different Line Widths
You can plot multiple lines with varying line widths to emphasize different lines. In this example, we will create a plot with three lines of different widths.
import matplotlib.pyplot as plt
import numpy as np

x = np.linspace(0, 2*np.pi, 100)
y1 = np.cos(x)
y2 = np.sin(x)
y3 = np.tan(x)

plt.plot(x, y1, linewidth=1, label='Line 1')
plt.plot(x, y2, linewidth=2, label='Line 2')
plt.plot(x, y3, linewidth=3, label='Line 3')
plt.legend()
plt.show()
Output:
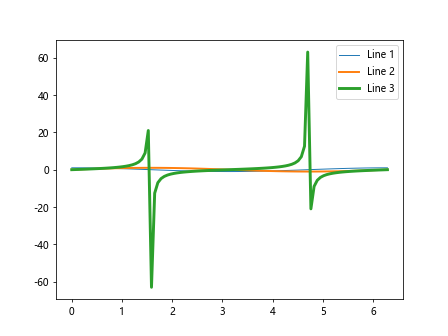
Here, we use different values for the linewidth parameter to set the line widths for each line.
Multiple Lines with Different Colors
You can plot multiple lines with different colors to differentiate between them. In this example, we will create a plot with three lines of different colors.
import matplotlib.pyplot as plt
import numpy as np

x = np.linspace(0, 2*np.pi, 100)
y1 = np.cos(x)
y2 = np.sin(x)
y3 = np.tan(x)

plt.plot(x, y1, color='red', label='Line 1')
plt.plot(x, y2, color='blue', label='Line 2')
plt.plot(x, y3, color='green', label='Line 3')
plt.legend()
plt.show()
Output:
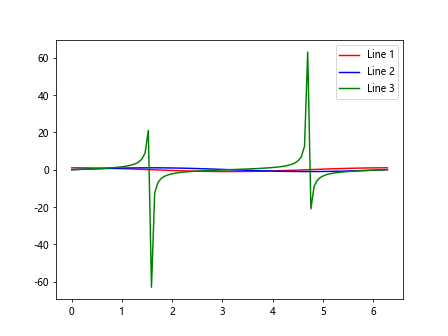
By setting the color parameter to different values, we can assign different colors to each line.
Multiple Lines with Different Markers
You can also plot multiple lines with different markers to distinguish data points. In this example, we will create a plot with three lines, each with a different marker.
import matplotlib.pyplot as plt
import numpy as np

x = np.linspace(0, 2*np.pi, 20)
y1 = np.cos(x)
y2 = np.sin(x)
y3 = np.tan(x)

plt.plot(x, y1, marker='o', label='Line 1')
plt.plot(x, y2, marker='s', label='Line 2')
plt.plot(x, y3, marker='^', label='Line 3')
plt.legend()
plt.show()
Output:
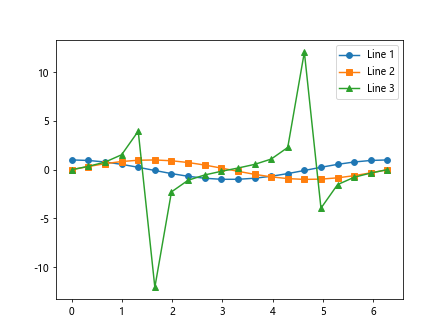
By specifying different markers using the marker parameter, we can add markers to each line.
Multiple Lines with Different Line Styles and Markers
You can combine different line styles and markers to create visually appealing plots. In this example, we will plot three lines with varying line styles and markers.
import matplotlib.pyplot as plt
import numpy as np

x = np.linspace(0, 2*np.pi, 100)
y1 = np.cos(x)
y2 = np.sin(x)
y3 = np.tan(x)

plt.plot(x, y1, linestyle='-', marker='o', label='Line 1')
plt.plot(x, y2, linestyle='--', marker='s', label='Line 2')
plt.plot(x, y3, linestyle='-.', marker='^', label='Line 3')
plt.legend()
plt.show()
Output:
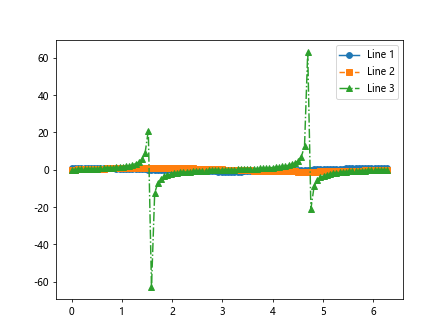
By combining different line styles and markers, we can create more visually engaging plots.
Matplotlib Multiple Lines Conclusion
In this article, we explored various ways to plot multiple lines using Matplotlib. We covered basic line plots with multiple lines, customization of line colors, styles, and markers, as well as annotations, stacked plots, subplots, and more. By experimenting with different parameters and techniques, you can create visually appealing and informative plots with multiple lines in Matplotlib.