Box Plot using Matplotlib
Box plot, also known as box-and-whisker plot, is a graphical representation of the distribution of a dataset based on five summary statistics: minimum, first quartile, median, third quartile, and maximum. In this article, we will explore how to create box plots using Matplotlib, a popular plotting library in Python.
Basic Box Plot
import matplotlib.pyplot as plt
import numpy as np

data = np.random.normal(0, 1, 100)
plt.boxplot(data)
plt.show()
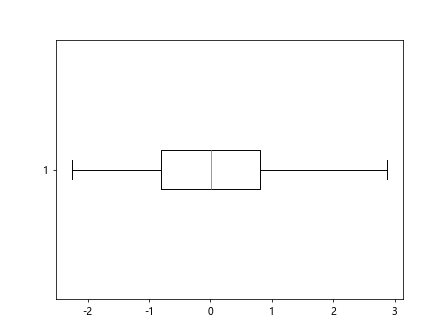
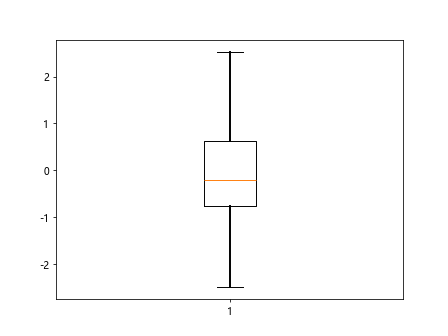
Horizontal Box Plot
import matplotlib.pyplot as plt
import numpy as np

data = np.random.normal(0, 1, 100)

plt.boxplot(data, vert=False)
plt.show()
Output:
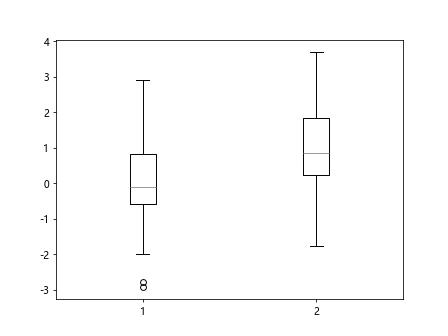
Multiple Box Plots
import matplotlib.pyplot as plt
import numpy as np

data = np.random.normal(0, 1, 100)

data1 = np.random.normal(0, 1, 100)
data2 = np.random.normal(1, 1, 100)

plt.boxplot([data1, data2])
plt.show()
Output:
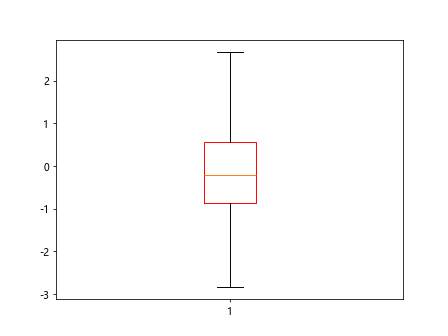
Customizing Box Plot Colors
import matplotlib.pyplot as plt
import numpy as np

data = np.random.normal(0, 1, 100)

plt.boxplot(data, boxprops=dict(color="red"))
plt.show()
Output:
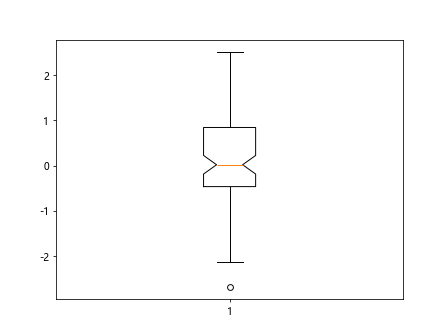
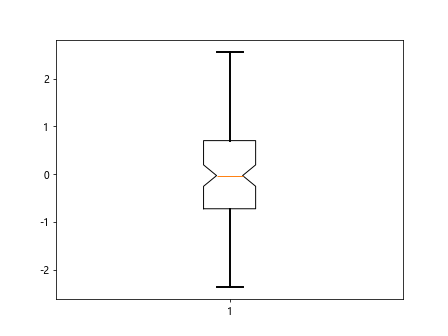
Notched Box Plot
import matplotlib.pyplot as plt
import numpy as np

data = np.random.normal(0, 1, 100)

plt.boxplot(data, notch=True)
plt.show()
Output:
Adding Whiskers to Box Plot
import matplotlib.pyplot as plt
import numpy as np

data = np.random.normal(0, 1, 100)

plt.boxplot(data, whiskerprops=dict(linewidth=2))
plt.show()
Output:
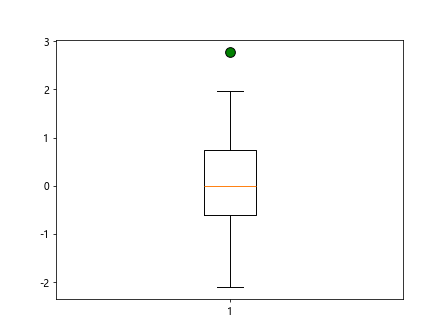
Change Whisker Style
import matplotlib.pyplot as plt
import numpy as np

data = np.random.normal(0, 1, 100)

plt.boxplot(data, flierprops=dict(marker='o', markerfacecolor='green', markersize=10))
plt.show()
Output:
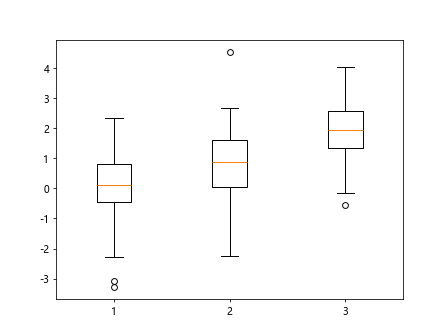
Grouped Box Plots
import matplotlib.pyplot as plt
import numpy as np

data = np.random.normal(0, 1, 100)

data1 = np.random.normal(0, 1, 100)
data2 = np.random.normal(1, 1, 100)
data3 = np.random.normal(2, 1, 100)

plt.boxplot([data1, data2, data3])
plt.show()
Output:
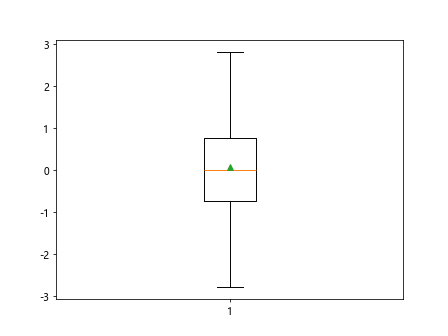
Adding Mean Line to Box Plot
import matplotlib.pyplot as plt
import numpy as np

data = np.random.normal(0, 1, 100)

plt.boxplot(data, showmeans=True)
plt.show()
Output:
Horizontal Grouped Box Plots
import matplotlib.pyplot as plt
import numpy as np

data = np.random.normal(0, 1, 100)

plt.boxplot([data1, data2, data3], vert=False)
plt.show()
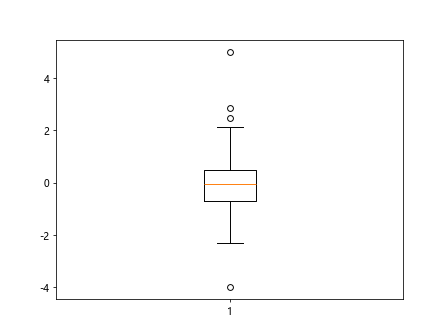
Box Plot with Outliers
import matplotlib.pyplot as plt
import numpy as np

data = np.random.normal(0, 1, 100)

data_with_outliers = np.random.normal(0, 1, 100)
data_with_outliers[0] = 5
data_with_outliers[1] = -4

plt.boxplot(data_with_outliers, showfliers=True)
plt.show()
Output:
Change Outlier Symbol
import matplotlib.pyplot as plt
import numpy as np

data = np.random.normal(0, 1, 100)

plt.boxplot(data_with_outliers, flierprops=dict(marker='x', color='red', markersize=10))
plt.show()
Notch Box Plot with Different Whisker Lengths
import matplotlib.pyplot as plt
import numpy as np

data = np.random.normal(0, 1, 100)

plt.boxplot(data, notch=True, capprops=dict(linewidth=2), whiskerprops=dict(linewidth=2))
plt.show()
Output:
Box Plot with Horizontal Grid Lines
import matplotlib.pyplot as plt
import numpy as np

data = np.random.normal(0, 1, 100)

plt.boxplot(data, whis=2, showmeans=True, grid=True)
plt.show()
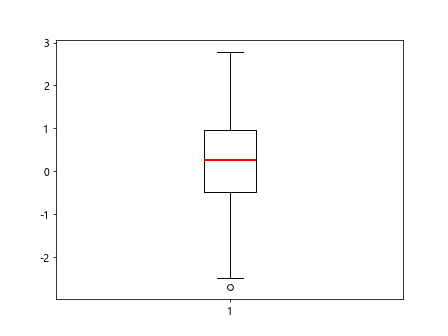
Box Plot with Horizontal Medians
import matplotlib.pyplot as plt
import numpy as np

data = np.random.normal(0, 1, 100)

plt.boxplot(data, medianprops=dict(color='red', linewidth=2))
plt.show()
Output:
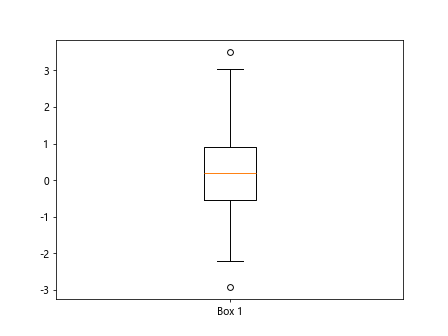
Box Plot with Customized Labels
import matplotlib.pyplot as plt
import numpy as np

data = np.random.normal(0, 1, 100)

plt.boxplot(data, labels=['Box 1'])
plt.show()
Output:
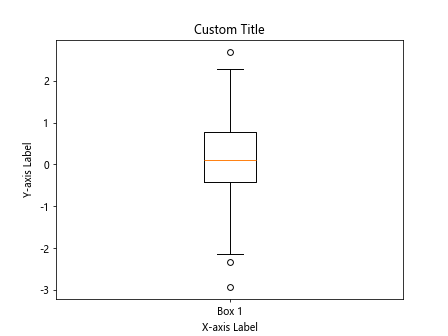
Box Plot with Customized Title and Labels
import matplotlib.pyplot as plt
import numpy as np

data = np.random.normal(0, 1, 100)

plt.boxplot(data, labels=['Box 1'])
plt.title('Custom Title')
plt.xlabel('X-axis Label')
plt.ylabel('Y-axis Label')
plt.show()
Output:
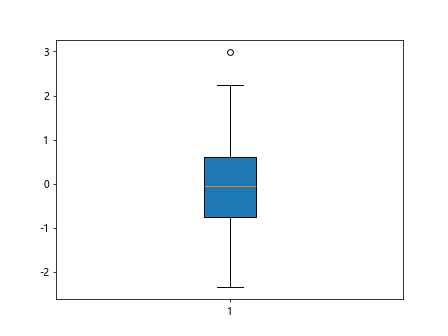
Box Plot with Horizontal Boxes
import matplotlib.pyplot as plt
import numpy as np

data = np.random.normal(0, 1, 100)

plt.boxplot(data, patch_artist=True)
plt.show()
Output:
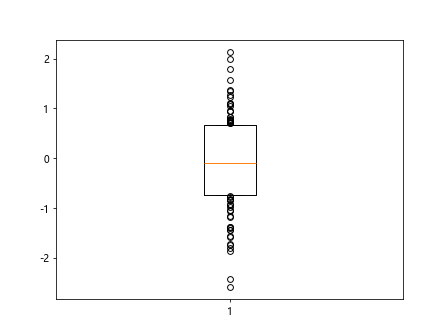
Box Plot without Whiskers
import matplotlib.pyplot as plt
import numpy as np

data = np.random.normal(0, 1, 100)

plt.boxplot(data, whis=0)
plt.show()
Output:
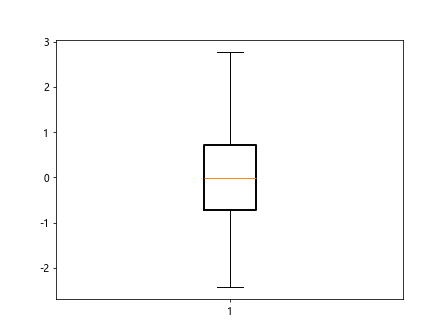
Box Plot with Thick Boxes
import matplotlib.pyplot as plt
import numpy as np

data = np.random.normal(0, 1, 100)

plt.boxplot(data, boxprops=dict(linewidth=2))
plt.show()
Output:
Box Plot using Matplotlib Conclusion
In this article, we have explored various ways to create box plots using Matplotlib in Python. Box plots are a powerful tool for visualizing the distribution of a dataset and identifying outliers. By customizing different aspects of the box plot such as colors, whiskers, outliers, and labels, we can effectively communicate our data insights. Experiment with the examples provided to gain a deeper understanding of box plots and their applications in data analysis.