Axis Label in Matplotlib
In Matplotlib, axis labels are important components of a plot as they help in understanding the data being displayed. In this article, we will explore how to add and customize axis labels in Matplotlib plots.
Adding Axis Labels
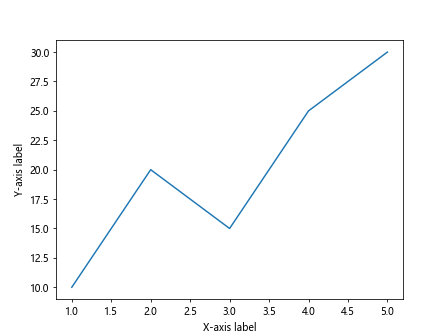
To add axis labels to a plot in Matplotlib, we can use the xlabel() and ylabel() functions. These functions take a string as an argument which specifies the label for the x-axis and y-axis respectively.
import matplotlib.pyplot as plt

x = [1, 2, 3, 4, 5]
y = [10, 20, 15, 25, 30]

plt.plot(x, y)
plt.xlabel('X-axis label')
plt.ylabel('Y-axis label')
plt.show()
Output:
Customizing Axis Labels
We can customize the appearance of axis labels by changing properties such as font size, font style, color, rotation, and alignment.
import matplotlib.pyplot as plt

x = [1, 2, 3, 4, 5]
y = [10, 20, 15, 25, 30]

plt.plot(x, y)

plt.xlabel('X-axis label', fontsize=12, fontstyle='italic', color='red', rotation=45, ha='right')
plt.ylabel('Y-axis label', fontsize=12, fontstyle='italic', color='blue', rotation=45, va='top')
Adding Units to Axis Labels
We can add units to axis labels by including them within the label string.
import matplotlib.pyplot as plt

x = [1, 2, 3, 4, 5]
y = [10, 20, 15, 25, 30]

plt.plot(x, y)

plt.xlabel('Time (s)')
plt.ylabel('Temperature (°C)')
Formatting Axis Labels
We can format axis labels using string formatting to display them in a specific way.
import matplotlib.pyplot as plt

x = [1, 2, 3, 4, 5]
y = [10, 20, 15, 25, 30]

plt.plot(x, y)

plt.xlabel('Value: {:.2f}')
plt.ylabel('Count: {:,}')
Adding Math Symbols to Axis Labels
Matplotlib supports LaTeX syntax for adding math symbols to axis labels.
import matplotlib.pyplot as plt

x = [1, 2, 3, 4, 5]
y = [10, 20, 15, 25, 30]

plt.plot(x, y)

plt.xlabel(r'$\theta$ (radians)')
plt.ylabel(r'$\lambda$ (meters)')
Adding Multiple Lines to Axis Labels
We can add multiple lines to axis labels by using newline characters \n.
import matplotlib.pyplot as plt

x = [1, 2, 3, 4, 5]
y = [10, 20, 15, 25, 30]

plt.plot(x, y)

plt.xlabel('Line 1\nLine 2')
plt.ylabel('Line 1\nLine 2')
Adding Axis Labels to Subplots
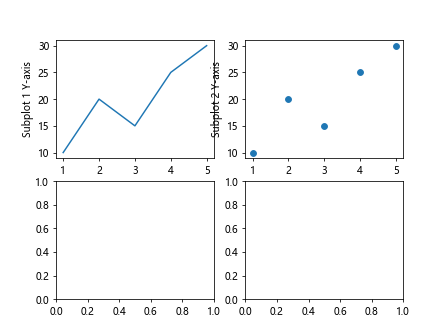
When working with subplots in Matplotlib, we can add axis labels to each subplot individually.
import matplotlib.pyplot as plt

x = [1, 2, 3, 4, 5]
y = [10, 20, 15, 25, 30]

fig, axs = plt.subplots(2, 2)

axs[0, 0].plot(x, y)
axs[0, 0].set_xlabel('Subplot 1 X-axis')
axs[0, 0].set_ylabel('Subplot 1 Y-axis')

axs[0, 1].scatter(x, y)
axs[0, 1].set_xlabel('Subplot 2 X-axis')
axs[0, 1].set_ylabel('Subplot 2 Y-axis')

plt.show()
Output:
Removing Axis Labels
If you want to remove axis labels from your plot, you can use the set_visible() function with False as an argument.
import matplotlib.pyplot as plt

x = [1, 2, 3, 4, 5]
y = [10, 20, 15, 25, 30]

plt.xlabel('X-axis label')
plt.ylabel('Y-axis label')

plt.gca().axes.xaxis.set_label_visible(False)
plt.gca().axes.yaxis.set_label_visible(False)
plt.show()
Axis Label in Matplotlib Conclusion
Axis labels are essential components of a plot in Matplotlib as they provide context and understanding to the data being displayed. By customizing and formatting axis labels, we can make our plots more informative and visually appealing.
In this article, we have covered various aspects of adding and customizing axis labels in Matplotlib, including adding units, formatting labels, adding math symbols, and working with subplots. By using these techniques effectively, you can create professional-looking plots with clear and descriptive axis labels.