Adding Axes Labels in Matplotlib
In Matplotlib, axes labels are used to provide additional information about the data being displayed on a plot. Axes labels include the x-axis label, y-axis label, and title. In this article, we will discuss how to add axes labels in Matplotlib plots with detailed examples.
Adding X-Axis Label
To add a label to the x-axis in a Matplotlib plot, you can use the xlabel() function. Here is an example code snippet:
import matplotlib.pyplot as plt

plt.plot([1, 2, 3, 4], [1, 4, 9, 16])
plt.xlabel('X-Axis Label - how2matplotlib.com')
plt.show()
Output:
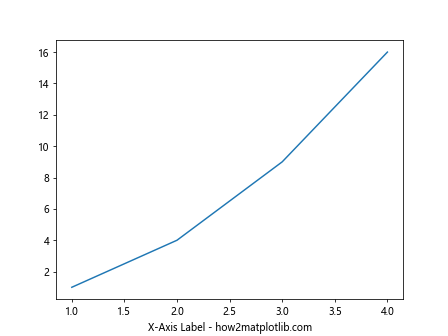
In the above code, we first create a simple line plot with plt.plot(), then add a label to the x-axis using plt.xlabel().
Adding Y-Axis Label
Similarly, you can add a label to the y-axis in a Matplotlib plot using the ylabel() function. Here is an example code snippet:
import matplotlib.pyplot as plt

plt.plot([1, 2, 3, 4], [1, 4, 9, 16])
plt.ylabel('Y-Axis Label - how2matplotlib.com')
plt.show()
Output:
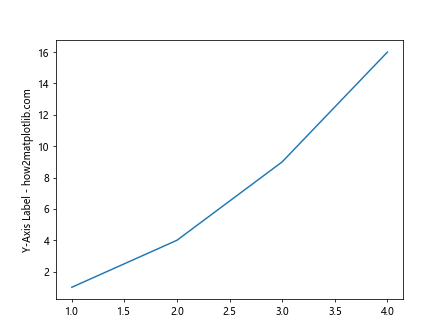
In the above code, we create a line plot and add a label to the y-axis using plt.ylabel().
Adding Title
To add a title to a Matplotlib plot, you can use the title() function. Here is an example code snippet:
import matplotlib.pyplot as plt

plt.plot([1, 2, 3, 4], [1, 4, 9, 16])
plt.title('Plot Title - how2matplotlib.com')
plt.show()
Output:
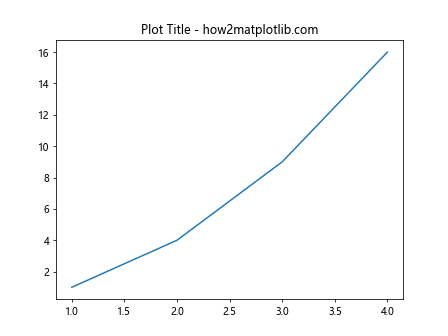
In the above code, we create a line plot and add a title using plt.title().
Customizing Axes Labels
You can customize the appearance of axes labels by specifying parameters in the xlabel() and ylabel() functions. Here is an example code snippet:
import matplotlib.pyplot as plt

plt.plot([1, 2, 3, 4], [1, 4, 9, 16])
plt.xlabel('X-Axis Label - how2matplotlib.com', fontsize=12, color='red')
plt.ylabel('Y-Axis Label - how2matplotlib.com', fontsize=12, color='blue')
plt.show()
Output:
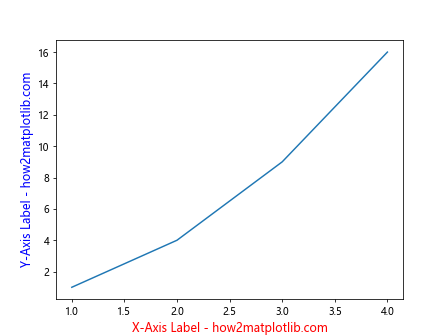
In the above code, we customize the font size and color of the x-axis and y-axis labels.
Multiple Axes Labels
You can add multiple axes labels to a plot by calling xlabel() and ylabel() multiple times. Here is an example code snippet:
import matplotlib.pyplot as plt

plt.plot([1, 2, 3, 4], [1, 4, 9, 16])
plt.xlabel('X-Axis Label - how2matplotlib.com', fontsize=12)
plt.ylabel('Y-Axis Label - how2matplotlib.com', fontsize=12)
plt.xlabel('Second X-Axis Label - how2matplotlib.com', fontsize=10, color='green')
plt.show()
Output:
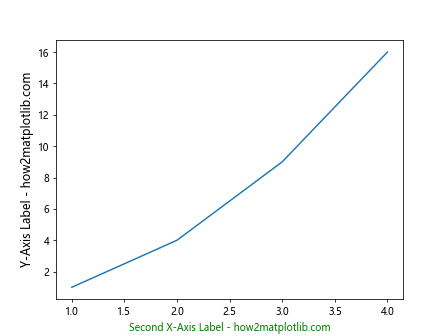
In the above code, we add two x-axis labels and one y-axis label to the plot.
Rotating Axes Labels
You can rotate the axes labels to make them easier to read by specifying the rotation parameter in the xlabel() and ylabel() functions. Here is an example code snippet:
import matplotlib.pyplot as plt

plt.plot([1, 2, 3, 4], [1, 4, 9, 16])
plt.xlabel('X-Axis Label - how2matplotlib.com', rotation=45)
plt.ylabel('Y-Axis Label - how2matplotlib.com', rotation=90)
plt.show()
Output:
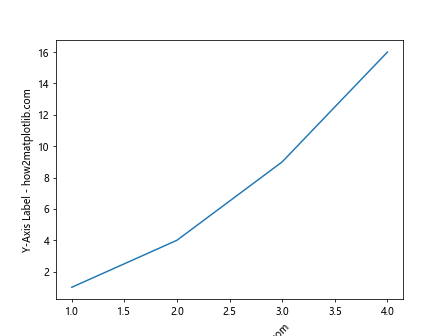
In the above code, we rotate the x-axis label by 45 degrees and the y-axis label by 90 degrees.
Adding Units to Axes Labels
You can add units to axes labels by including them in the label text. Here is an example code snippet:
import matplotlib.pyplot as plt

plt.plot([1, 2, 3, 4], [1, 4, 9, 16])
plt.xlabel('Time (s) - how2matplotlib.com')
plt.ylabel('Voltage (V) - how2matplotlib.com')
plt.show()
Output:
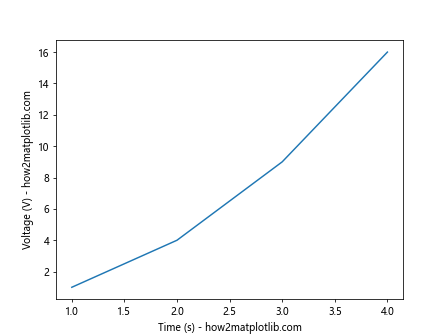
In the above code, we add units (seconds and volts) to the x-axis and y-axis labels.
Adding LaTeX Expression in Axes Labels
Matplotlib supports LaTeX expressions in axes labels, allowing you to format labels with mathematical notation. Here is an example code snippet:
import matplotlib.pyplot as plt

plt.plot([1, 2, 3, 4], [1, 4, 9, 16])
plt.xlabel('$\\alpha$ - how2matplotlib.com')
plt.ylabel('$\\beta$ - how2matplotlib.com')
plt.show()
Output:
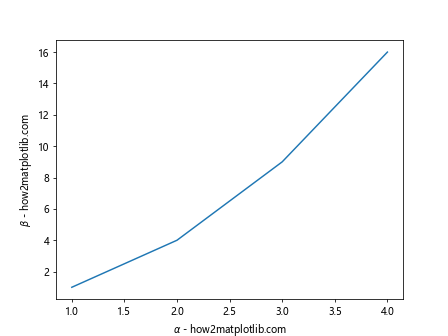
In the above code, we use LaTeX expressions to display Greek symbols in the x-axis and y-axis labels.
Adding Axes Labels to Subplots
When working with subplots in Matplotlib, you can add axes labels to each subplot independently. Here is an example code snippet:
import matplotlib.pyplot as plt

fig, axs = plt.subplots(2)
axs[0].plot([1, 2, 3, 4], [1, 4, 9, 16])
axs[0].set_xlabel('X-Axis Label - how2matplotlib.com')
axs[0].set_ylabel('Y-Axis Label - how2matplotlib.com')
axs[1].plot([1, 2, 3, 4], [1, 4, 9, 16])
axs[1].set_xlabel('X-Axis Label - how2matplotlib.com')
axs[1].set_ylabel('Y-Axis Label - how2matplotlib.com')
plt.show()
Output:
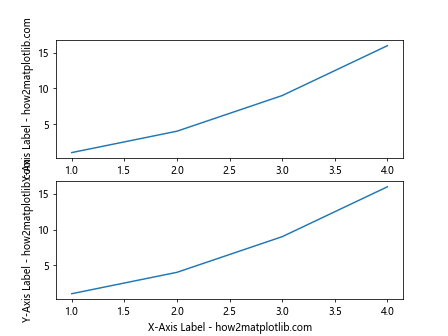
In the above code, we create a figure with two subplots and add axes labels to each subplot.
Hiding Axes Labels
If you want to hide the axes labels in a plot, you can use the set_visible() function. Here is an example code snippet:
import matplotlib.pyplot as plt

fig, ax = plt.subplots()
ax.plot([1, 2, 3, 4], [1, 4, 9, 16])
ax.set_xlabel('X-Axis Label - how2matplotlib.com')
ax.set_ylabel('Y-Axis Label - how2matplotlib.com')
ax.xaxis.set_visible(False)
ax.yaxis.set_visible(False)
plt.show()
Output:
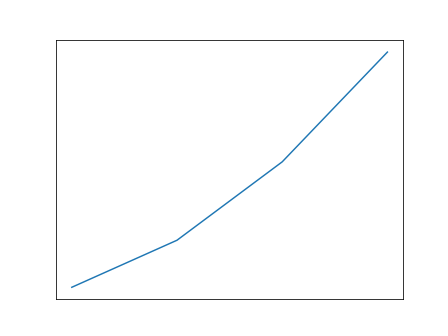
In the above code, we hide both the x-axis and y-axis labels in the plot.
Adding Axes Labels in Matplotlib Conclusion
In this article, we have discussed how to add axes labels to Matplotlib plots. We covered adding x-axis labels, y-axis labels, titles, customizing labels, rotating labels, adding units, using LaTeX expressions, adding labels to subplots, and hiding labels. By following the examples provided, you can effectively add axes labels to your Matplotlib plots and enhance the clarity of your visualizations.