Change Marker Size in Matplotlib
Matplotlib is a popular plotting library for Python that allows users to create various types of plots, including scatter plots, line plots, bar plots, and more. One important aspect of creating plots in Matplotlib is customizing the appearance of markers, such as changing their size. In this article, we will explore how to change the marker size in Matplotlib.
Scatter Plot with Custom Marker Size
The scatter function in Matplotlib is used to create scatter plots. We can customize the marker size by specifying the s parameter, which controls the marker size. Here is an example of creating a scatter plot with custom marker size:
import matplotlib.pyplot as plt

# Data
x = [1, 2, 3, 4, 5]
y = [2, 3, 4, 5, 6]
sizes = [20, 50, 80, 110, 140]

plt.scatter(x, y, s=sizes)
plt.show()
Output:
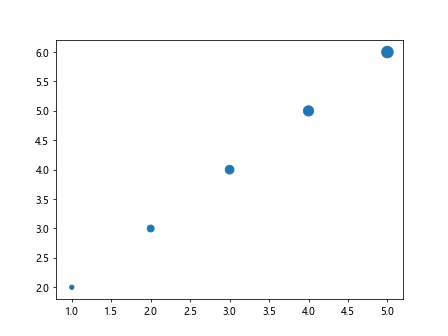
In this example, we have set the marker sizes to [20, 50, 80, 110, 140] for each data point.
Set Default Marker Size
If you want to change the default marker size for all scatter plots in a Matplotlib session, you can use the rcParams configuration. Here is an example of setting the default marker size to 100:
import matplotlib.pyplot as plt
import matplotlib as mpl

# Set default marker size
mpl.rcParams['lines.markersize'] = 100

# Data
x = [1, 2, 3, 4, 5]
y = [2, 3, 4, 5, 6]

plt.scatter(x, y)
plt.show()
Output:
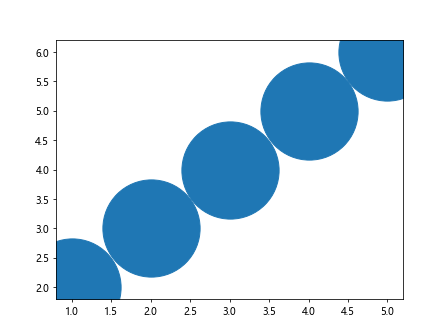
Now, all the scatter plots in this session will have a default marker size of 100.
Change Marker Size Dynamically
You can also change the marker size based on a condition or a variable. Here is an example of changing the marker size dynamically based on the value of a variable sizes:
import matplotlib.pyplot as plt

# Data
x = [1, 2, 3, 4, 5]
y = [2, 3, 4, 5, 6]
sizes = [20, 50, 80, 110, 140]

plt.scatter(x, y, s=sizes)
plt.show()
Output:
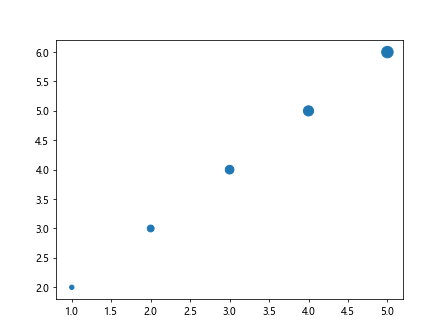
In this example, the marker size for each point will be determined by the corresponding value in the sizes list.
Bubble Chart
A bubble chart is a variation of a scatter plot where the marker size represents a third dimension, in addition to the x and y coordinates. Here is an example of creating a bubble chart in Matplotlib:
import matplotlib.pyplot as plt

# Data
x = [1, 2, 3, 4, 5]
y = [2, 3, 4, 5, 6]
sizes = [20, 50, 80, 110, 140]

plt.scatter(x, y, s=sizes)
plt.show()
Output:
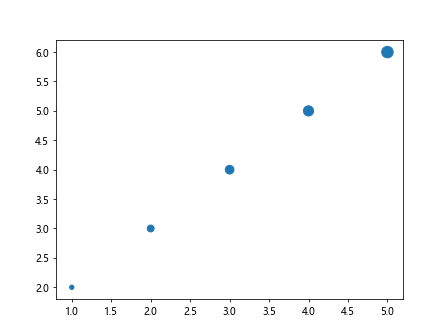
In this example, the marker size represents a third dimension of the data.
Customize Marker Size in Other Plot Types
Apart from scatter plots, you can also customize marker size in other plot types, such as line plots and bar plots. Here is an example of changing marker size in a line plot:
import matplotlib.pyplot as plt

# Data
x = [1, 2, 3, 4, 5]
y = [2, 3, 4, 5, 6]

plt.plot(x, y, marker='o', markersize=10)
plt.show()
Output:
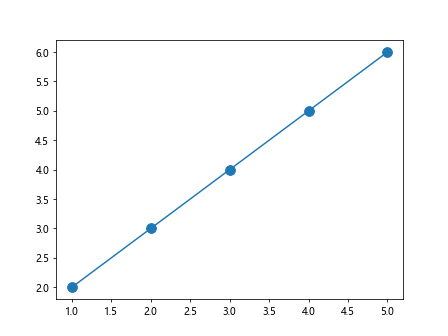
In this example, we have set the marker size to 10 for the data points in the line plot.
Change Marker Size in Matplotlib Conclusion
In this article, we have explored how to change the marker size in Matplotlib. We have seen how to customize marker size in scatter plots, set default marker size, change marker size dynamically, create bubble charts, and customize marker size in other plot types. By using the examples and techniques provided in this article, you can effectively customize the marker size in your Matplotlib plots to suit your data visualization needs.